Anti-Jewish Riots and Royal Communication Networks in Aragon

Royal Communication Networks in Aragon During Anti-Jewish Riots : 1391-1392

by Kaitlyn Thomas-Franz

Introduction

This past semester I had the opportunity to work with Professor Franklin Lyons on an exploratory data analysis project relating to a series of anti-Jewish riots that occurred in the crowns of Castile and Aragon between 1391 and 1392.  The initial intent for the project was to gather as much information as possible for each city where a riots were recorded as having taken place, generating a relative timeline of events relating to the riots for each of the cities.

Method

Starting our data collection by focusing of the territory of Aragon, I performed a close reading of both Benjamin Gampel’s book Anti-Jewish Riots in the Crown of Aragon and the Royal Response and Abigail Agresta’s article on the riots that occurred in the city of Valencia, “‘Unfortunate Jews’ and Urban Ugliness: Crafting a Narrative of the 1391 Assault on the Jueria of Valencia.”  Noting each line of text where a date was given for a particular event, I recorded each of these incidents on an Excel spreadsheet.  I also tagged each events using the following categories:

riot_1391
legal_pre
legal_post
violence_post
violence_pre
communication
travel_royal_official
travel_king
and
travel_city_representative.

The first label notes the date or dates when rioting occurred in a city.  The “legal” labels refer to judicial actions that occurred either before or after the riots, including legal actions against Jewish communities and the arrest/execution of rioters.  In connection, the “protection” label refers to any official decrees specifying the protection of the Jewish community of a city independent of judicial punishments.  The “violence” labels note events of violence committed either against the Jews or against a city that are distinct from the riots themselves while the “communication” label notes letters sent between royal and city officials.  Finally, the “travel” labels note the movement of royal and city officials across cities.

Network Analysis: Preliminary Network

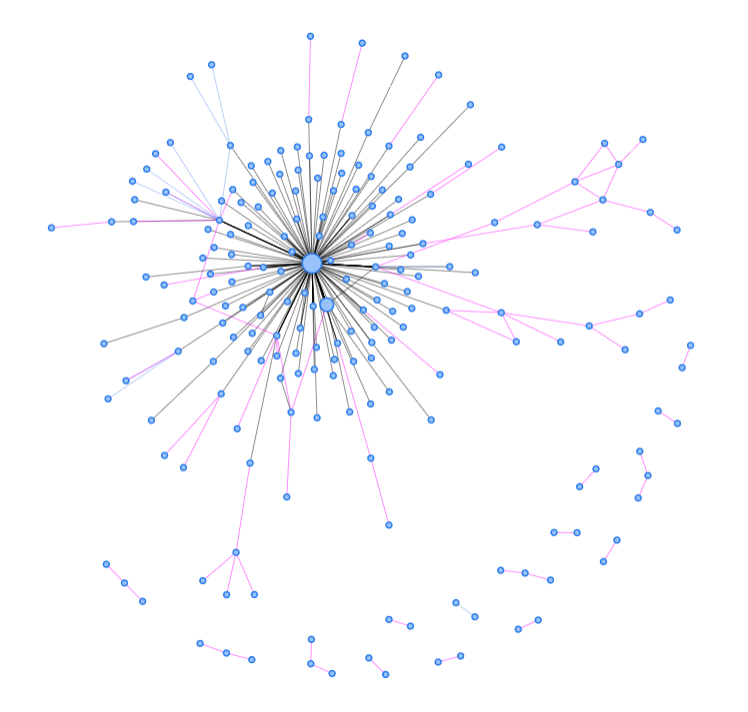
When I finished my preliminary timelines of events for Aragon, however, I noticed that  the majority of the information about the events was derived from letters written between royal and city officials.  Thus, Professor Franklin Lyons and I decided to narrow to scope of the project for the time being to a network analysis of the communication webs to see what sort of information could be gathered about the institutional response to the riots in relation to different groups’ geographical jurisdictions.  In all, the network I generated is comprised of 291 letters from King Joan (the ruler of Aragon), Queen Iolant (his wife), and other Royal and City Officials, with a main focus on communications being between July 1391 and April 1392, which is the month in which major rioting ceased in Aragon.  Using Gephi, I generated a preliminary network that I then color-coded based on its modularity centrality, the number of distinct clusters within the broader network.  As seen below, the network is comprised of three distinct communications groups: King Joan, Queen Iolant, and Duke Marti and Duchess Maria (Joan’s brother and his sister-in-law).

Networks: Duke Marti and Duchess Maria

Curious as to how the sub-networks of each of these royal figures connected to their respective jurisdictions, I generated a series of maps in R that reflect the different regions to which King Joan, Queen Iolant, Duke Marti and Duchess Maria sent communications and noted the content of each geographically-based link.  Below I have feature examples of the networks I created for Duke Marti and his wife.


Image: Map of Duke Marti’s communications network

Present in Valencia when riots occurred in the city in July, Duke Marti remains there for the remainder of the year.  As the crown prince, Marti had direct responsibility for the city, which is a potential reason why there are so few communications from King Joan to the city during the first month following the rioting.  Marti was also the first duke of Montblanc, which explains his communications with a city far from his purview during the rioting activity.  Nonetheless, the network also highlights that Duke Marti maintained extensive communications with both his brother and his wife, thereby suggesting a more unified royal reaction to the rioting occurring in the city.


Image: Map of Duchess Maria’s communications network

While the duchess resided in Tarrega, Catalonia for much of 1391, she maintained consistent communications with cities in the northern section of Aragon.  Because her father was the lord of Luna and the other two regions were under the jurisdiction of her husband, her contact with those cities is evidence of her use of family networks as a means of both relaying information about the riots to those cities as well as attempting to prevent rioting in those regions.  Furthermore, this network demonstrates that Maria shared equal responsibility with her husband in the operation of their jurisdiction, acting as his political representative when he was occupied by the rioting in Valencia.

Conclusion

This project was a valuable introduction to the Traveler’s Lab, allowing me to learn how to use both R and Gephi to generate intricate communication networks.  In the future, I hope to continue with this project by expanding the number of featured communications as the majority are from King Joan and other royal officials as opposed to city officials.  Furthermore, I hope to gather additional sources in order to develop similar event timelines and communications networks for the rioting activity in the crown of Castile.

Exploring Institutional Structures and Individual Networks

by Helen Birkett

I’ve been in residence at the Traveler’s Lab this semester and have taken the opportunity to work with Wesleyan students to extend my study of Caesarius of Heisterbach’s social network. The results, so far, are promising…

Background

My project uses the Dialogue on Miracles by Caesarius of Heisterbach (c.1180-c.1240) as a case study for investigating the structure of Cistercian social networks c.1200. Caesarius was a monk at the Cistercian abbey of Heisterbach in Germany and my project examines the social interactions recorded in his most famous work, the Dialogue on Miracles, which was written in the late 1210s and early 1220s. I started this project as a way of exploring the possibilities of network analysis and to test out a hypothesis that underlay my work on interactions between Cistercians in Britain at around the same time.

The Cistercian order developed a particularly extensive and regular system of communication between its abbeys. This was partly the result of the way in which the order expanded: new houses were founded by a group of monks setting out from one community, the mother house, to begin another, a daughter house. This meant that the Cistercian order was structured like a family tree in which each community could trace its relationship back to Cîteaux, the founding house, through lines of filiation. Importantly, the Cistercians used these relationships to maintain discipline and uniformity in the order: each year the abbots attended an annual general chapter at Cîteaux; and each year the abbot of a mother house was required to visit each of the abbey’s daughter houses.

My research investigates how this structure functioned as a communication network for the transmission of miracle stories. Although sparse and sporadic, my British source material was already suggesting that this structure was less important in the transmission of stories than I had anticipated. The Dialogue on Miracles, a large work of 746 chapters in 12 books or 805 stories, provided a much bigger dataset with which to test these ideas. It also gave me the chance to compare new digital approaches with the more traditional analytic techniques employed by Brian Patrick McGuire in his classic study of Caesarius’ social network.

Research Questions

I began research on this project a couple of years ago in collaboration with Pádraig Mac Carron, a physicist and network analysis expert at the University of Oxford. The project is based on two main research questions:

  1. How useful is network analysis for understanding the transmission of exempla in the Dialogue on Miracles?
  2. To what extent does Caesarius’ communication network correspond to Cistercian lines of filiation?

The first question is the more explorative, fun one – it really asked, can I use network analysis to look at this material? The initial response to this was… kind of. I created a database of interactions that recorded Caesarius’ sources for his stories, which Pádraig converted into a visualization. However, the resulting ‘network’ was limited and artificial – as might have been expected from the nature of the sample, it was almost entirely based on Caesarius. The addition of the few stories which had a provenance not directly linked to Caesarius (i.e. he doesn’t tell us how he heard them) did little to complicate the picture (these are the red dashed lines below).

Visualization of Caesarius’ sources (Pádraig Mac Carron)

The second question engaged with this data in a more sophisticated way and provided some more promising insights. My research showed that while some of the interactions in Caesarius’ text followed expected lines of filiation, a surprising number of interactions jumped between filiations.

Caesarius at the Lab

My collaboration with the Traveler’s Lab is allowing me to pursue these questions further. Two Lab members, Rachel Chung and Rebecca Greenberg, are working with me to create an extended dataset that records the interactions within the stories themselves. Our aim is to use this new, extended dataset to complicate Caesarius’ network – to use interactions in the more fictionalised narratives of the text to offer a more realistic picture of the Dialogue’s social world (it’s a conceit that appeals strongly to my literary side!). This extended dataset should also offer further insights into the question of Cistercian communication structures vs social reality.

This new dataset includes only direct interactions between identifiable individuals. This means it excludes implied relationships (such as familial relationships) unless the two individuals talk, write to each other, or interact directly in some way. This does create an element of artificiality in the data, but it also means we focus on who is actually talking to whom rather than expected interactions. We’re also only listing identifiable individuals to make sure that we can merge these datasets and networks successfully. As a result, I’ve had to refine my original dataset for Caesarius’ sources, which included a lot of anonymous individuals and the potential for double-counting.

Visualization of interactions within the Dialogue of Miracles (Elizaveta Kravchenko)

Currently, we are a third of the way through the data and the results are promising. This visualization, produced by another Lab member, Liza Kravchenko, shows the integrated networks of Caesarius’ sources (black), the additional external sources for his stories (blue), and the interactions within the stories themselves (pink). The nature of the material means that Caesarius will always dominate this network, but this visualization suggests that something more complex and realistic is starting to emerge.

Further Research

As usual, creating one dataset prompts you to think about creating another to offer a fuller or slightly different analysis of the material. Here it’s become clear that a dataset of family networks within the text would be a useful way of investigating individual and institutional connections, and something that should be integrated into the social network of the Dialogue. We could also extend our dataset to include interactions with divine beings, although I remain unconvinced of the value of doing this. Finally, my attendance at the Social Science History Association Conference in Montreal last weekend drew my attention to other ways of visualising textual data, which might be used to make simple, but effective points, about the geographical or thematic biases of my material. These visualizations were based on qualitative data analysis (QDA), which is pretty easy if you have clear search terms but, if not, will be a much more labour-intensive process – and I need to give more thought as to whether the effort involved here is really worth the result.