Comparing Chronicles at the IMC Leeds 2025: The Annals of Fulda—Events Over Years as a New History of the Text?
By Jesse W. Torgerson
On behalf of the Comparing Chronicles Team: Churchill Couch, Zaray Dewan, Arla Hoxha, Diana Tran, Tess Usher
The Comparing Chronicles Project took some significant methodological and theoretical steps in 2024-25. The project began in 2023 as an investigation into (1) frameworks of historical time; and, (2) what historians could do with only partially accurate data. By Summer of 2024 the project had turned to nothing less than developing an alternative to the Historical-Critical Method of studying a text. The following narrates a stage on this journey, and a bit of how we got here.
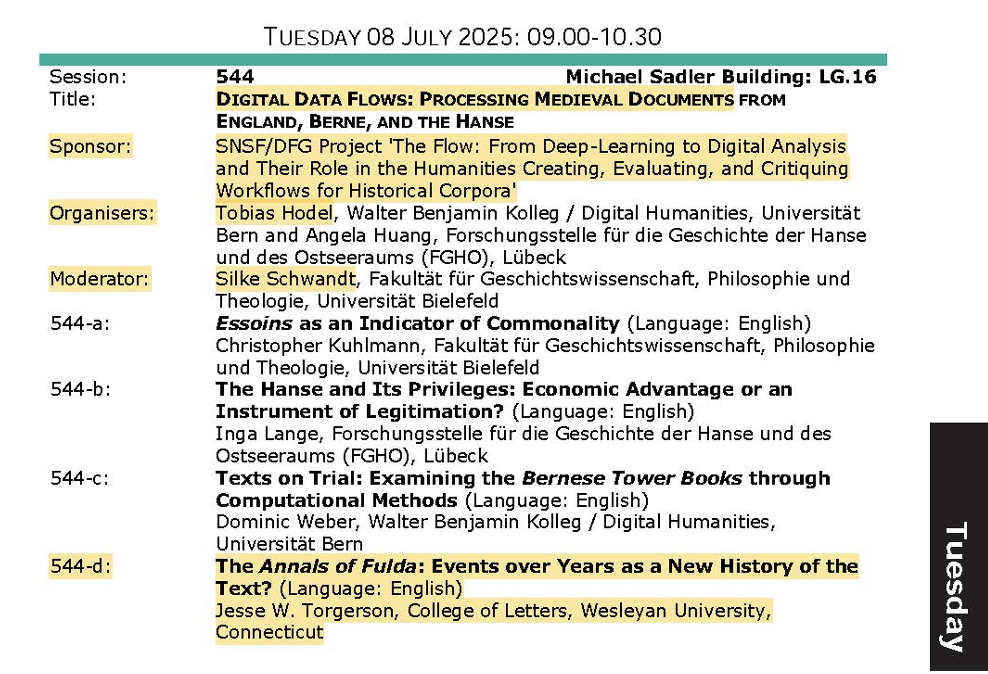
The Comparing Chronicles project was invited by The Flow Project to participate in a panel at the July 2025 International Medieval Congress at Leeds University.
The Flow Project (led by Tobias Hodel at University of Bern and Silke Schwandt at Bielefeld Universität) purues “standardized digital workflows based on existing technology, making it easier for researchers to work with historical sources digitally.” This simple statement contains a significant advance in the Digital History (and Theory) landscape. “Digital workflows” are already a part of historical methods, but without concerted efforts to collaborate with each other scholars find themselves each inventing different but functional versions of the wheel (or, to give a more relevant example, parallel means of extracting machine readable text from handwritten sources).
Panel 544 Digital Data Flows promised difference means of processing medieval documents, and allowed us to present the work done in our Comparing Chronicles project as a unique example of what difference a standardized digital workflow could mean for comparative study of Early Medieval Chronicles from the example of three different versions of the Annales Fuldenses (Annals of Fulda).

The following is an abbreviated version of the remarks made at this panel.
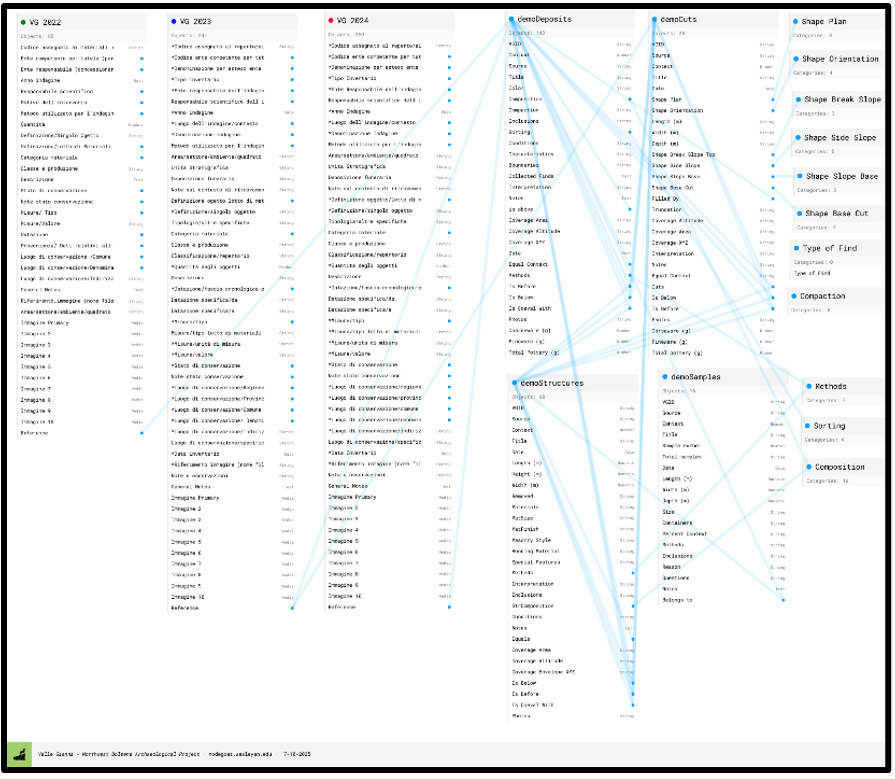
Our Comparing Chronicles Project has been constructed using the web-based relational database tool Nodegoat. We have used the Nodegoat Go license subscription at Wesleyan University Library to create a fully collaborative research environment.
As our team builds this database together we are constantly re-thinking our processes (i.e., our Digital Data Flows) and as a result continually updating our methodology, which takes the form of a new structure to our relational database.
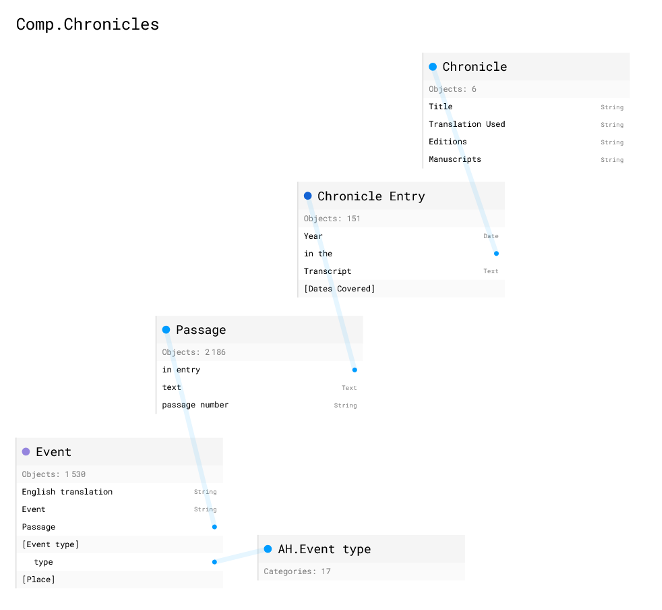
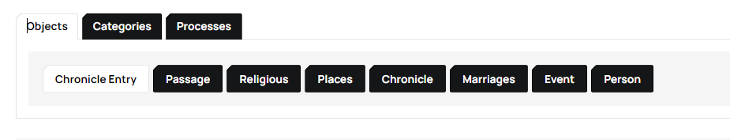
The most significant shift in the past year has been to shift from a TEI-based methodology to one that distinguishes different elements of the text and its structure as distinct but related datasets (or, in Nodegoat’s terms, “Objects”).
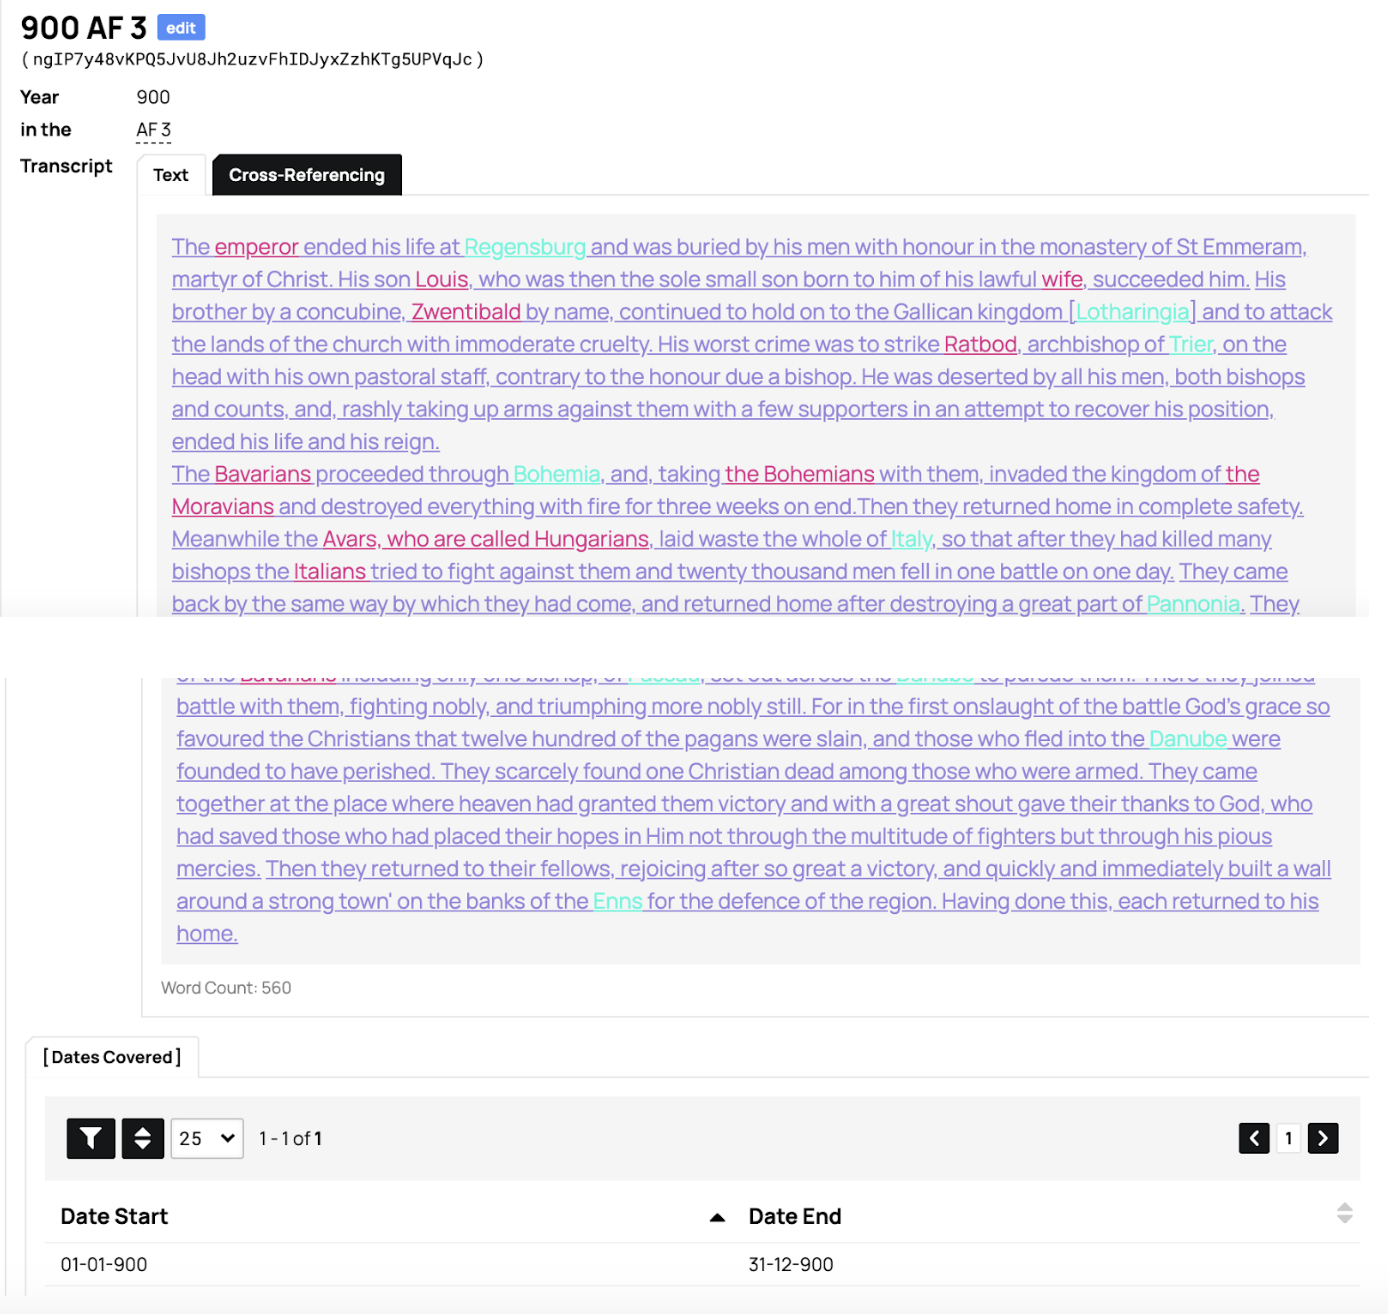
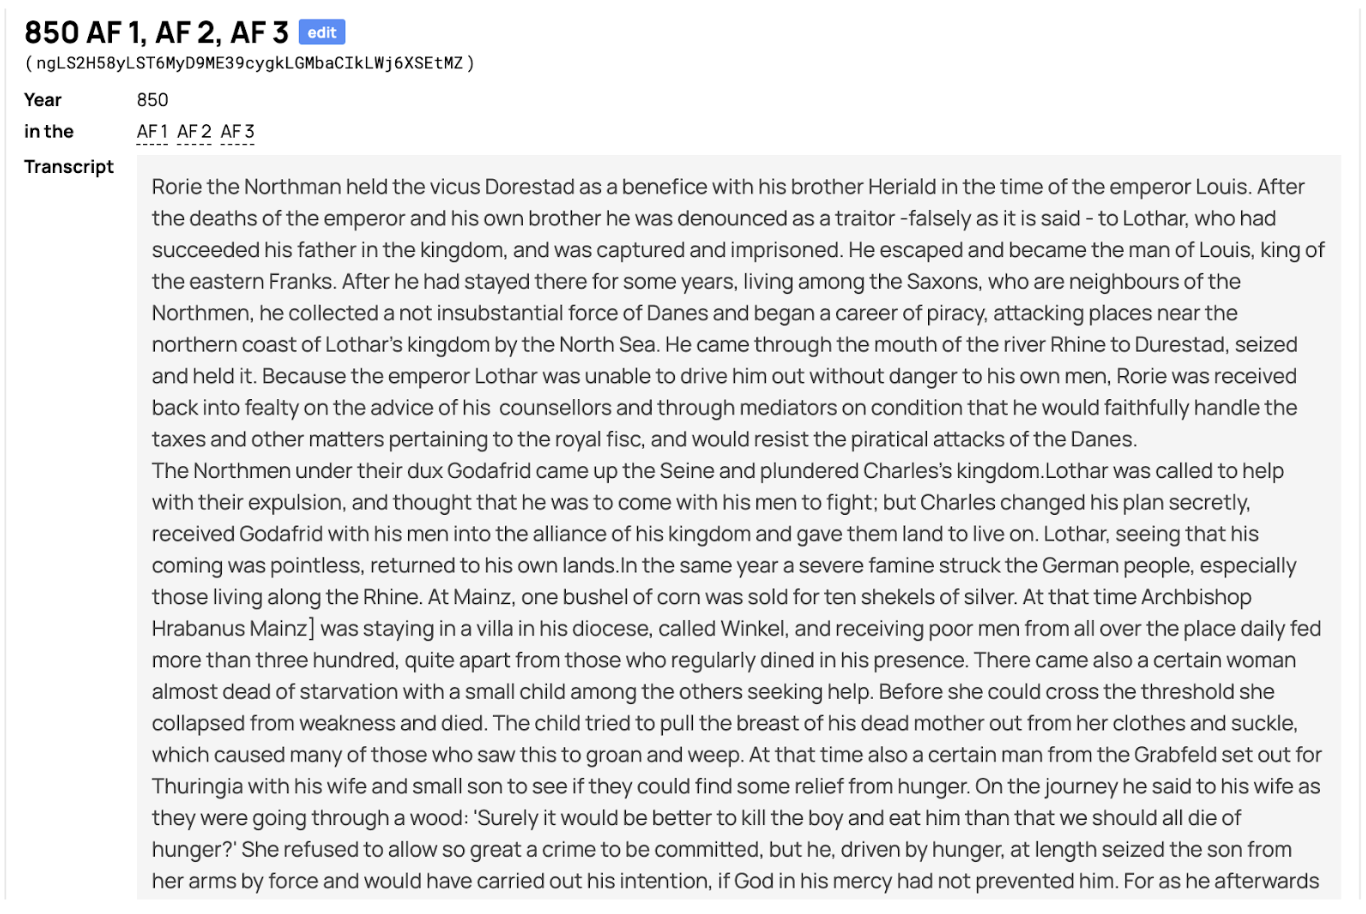
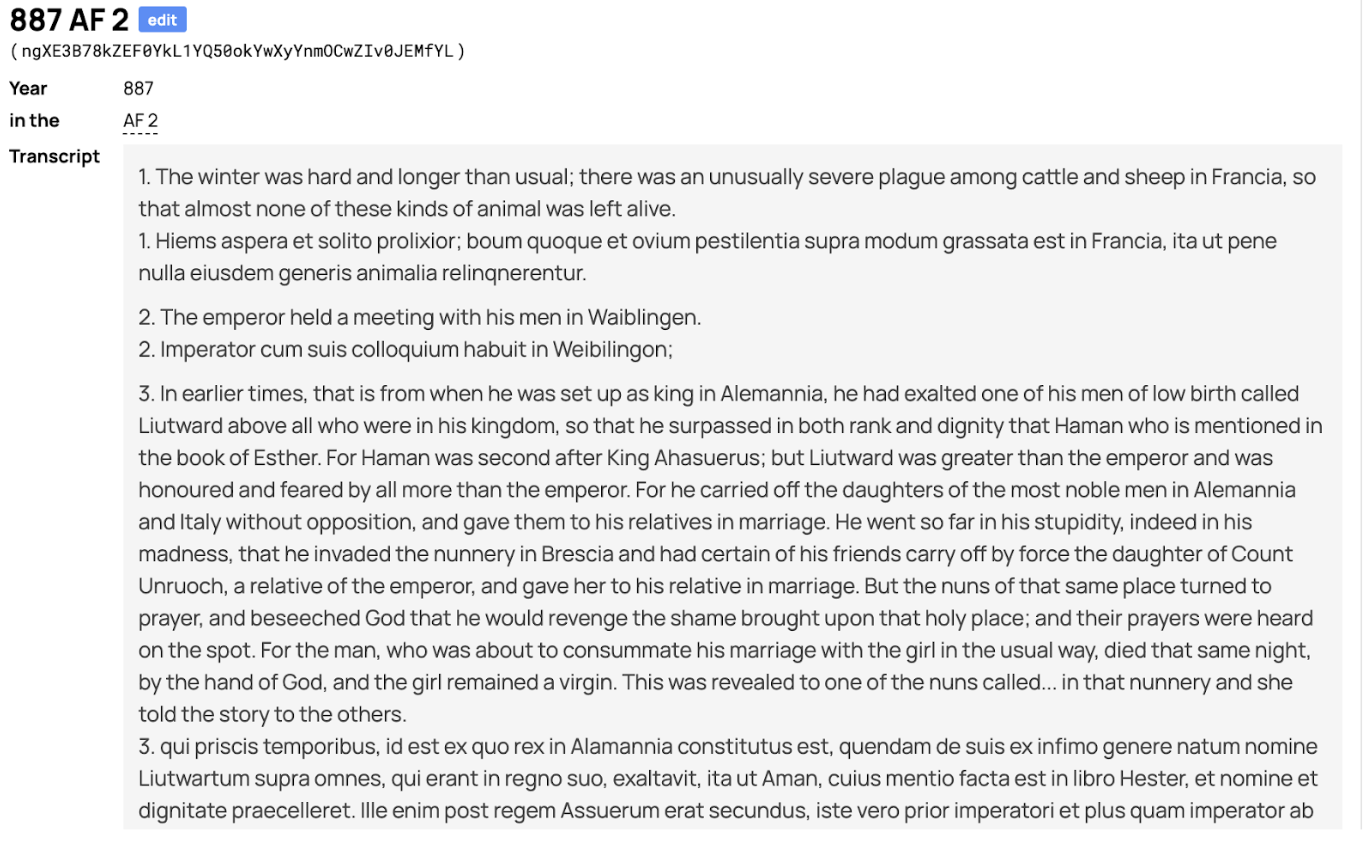
Each of the boxes in the above image indicates a distinct dataset. Chronicle is the title of the work (in the next stage of our project it will be a specific manuscript). The Chronicle Entry is the text under each year in that chronicle, in both Latin and (for reference) English, providing the text as it appears in each work (or, eventually: transcribed manuscript).
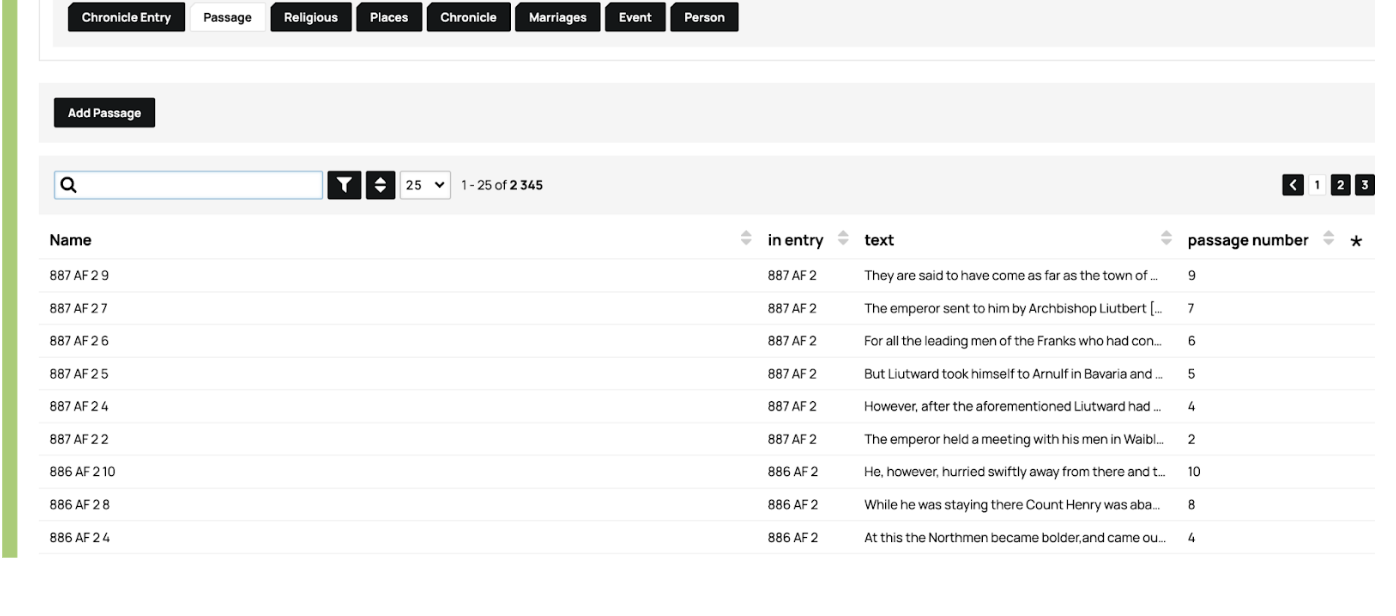
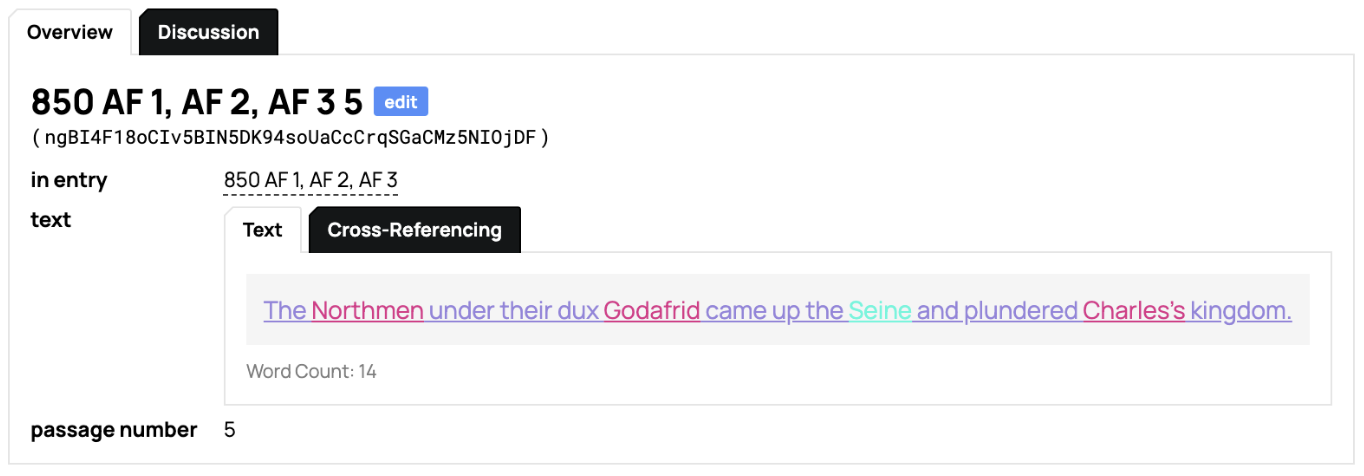
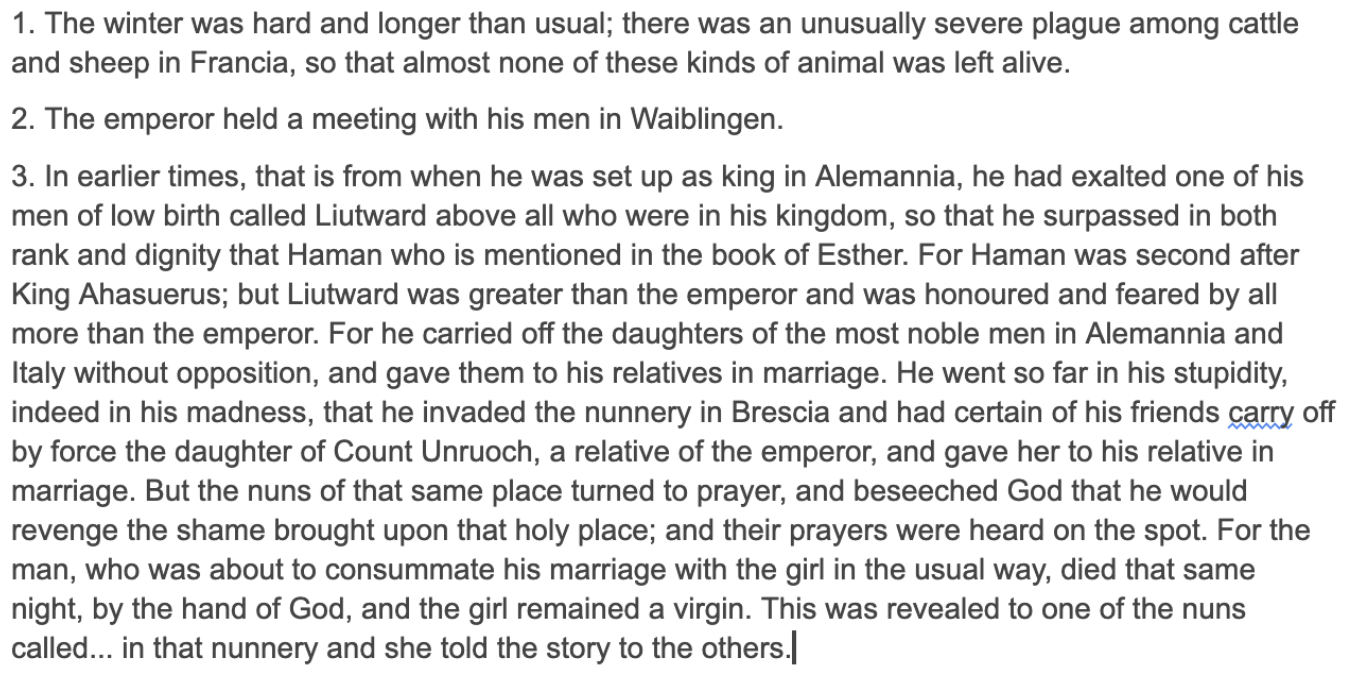
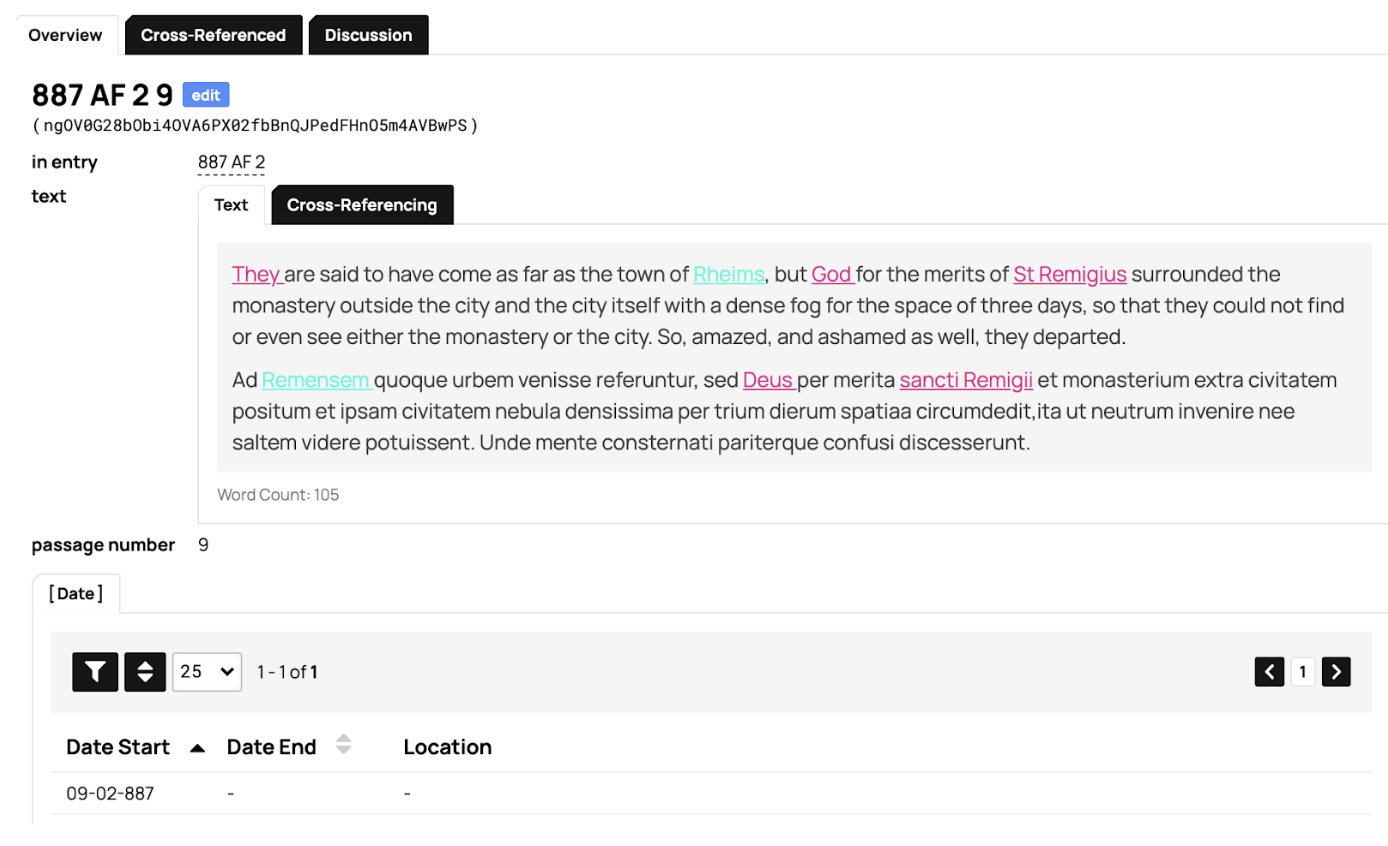
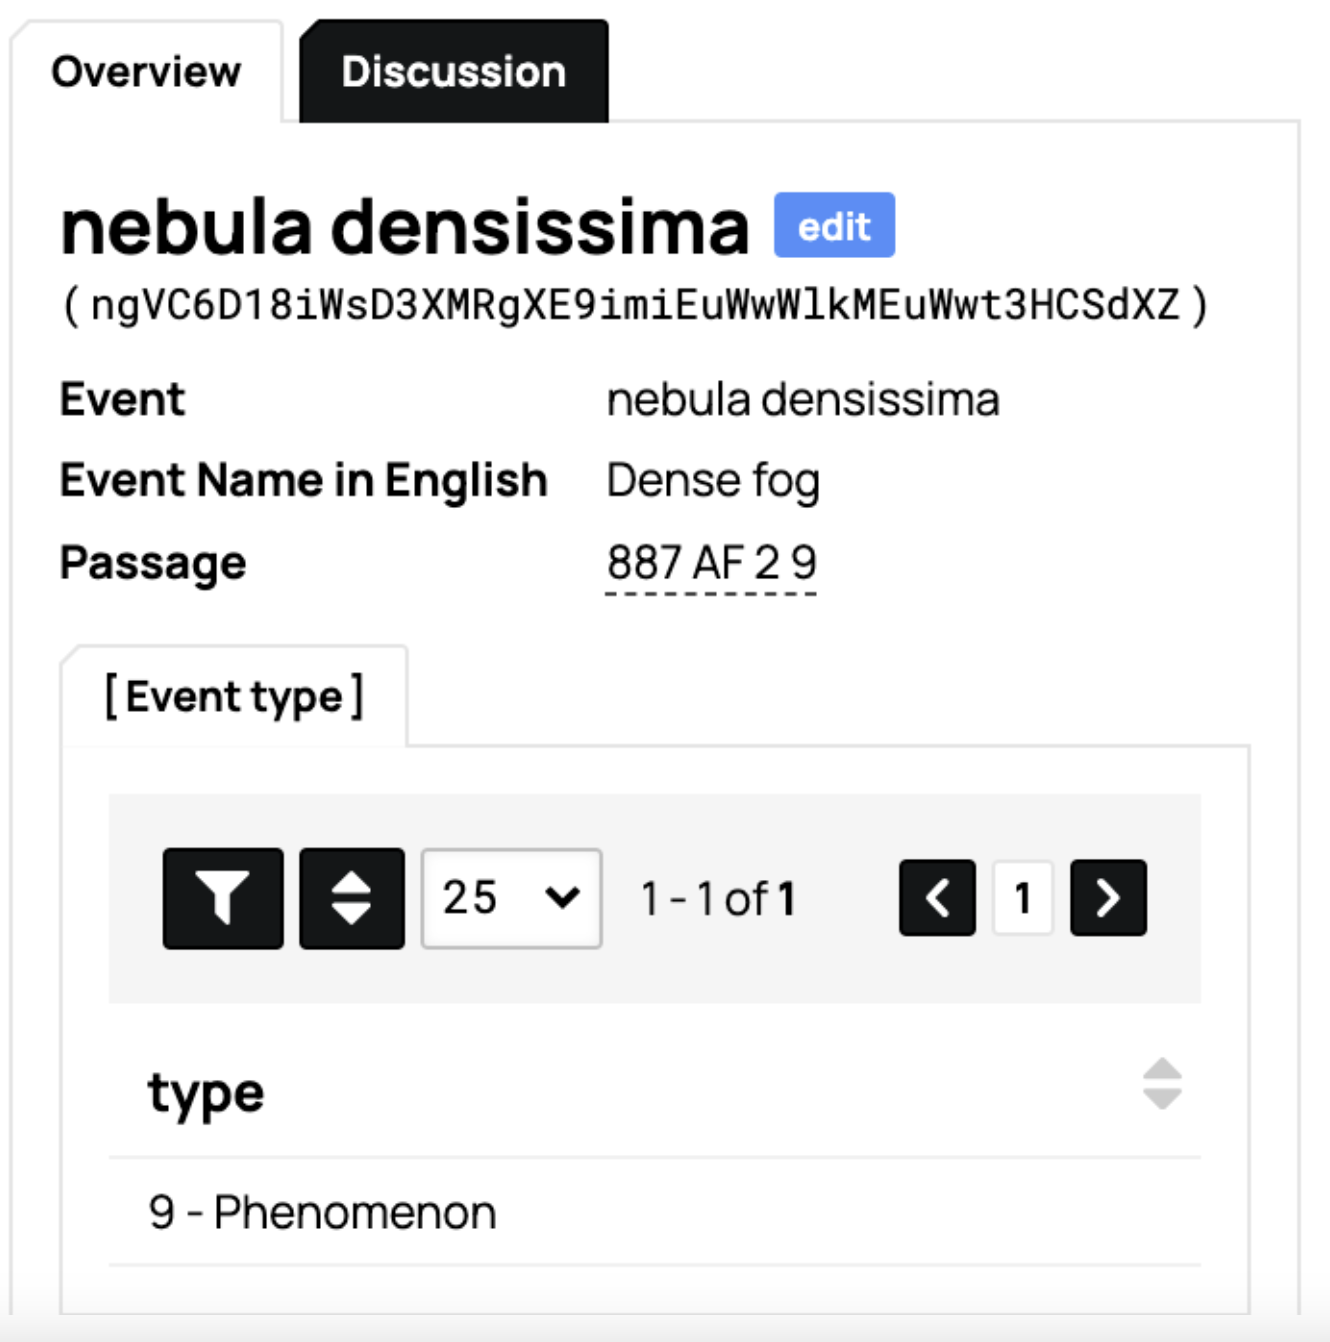
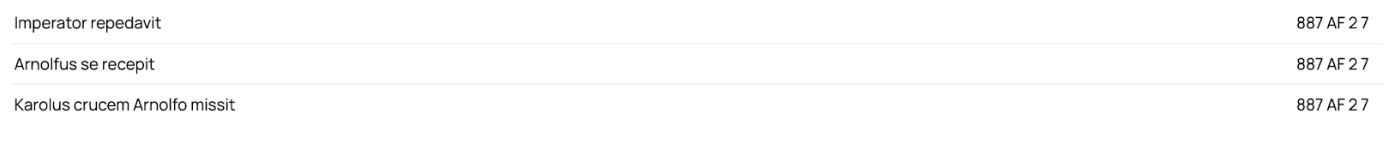
The next two datasets represent two levels of our distinctive analytical contribution to study of the text. Passage is the division of each annual entry’s text into distinct narrative sections, and the delineation of those narrative sections by the order (“Passage Number”) in which they occur in the annual entry. Thus the “name” of a passage might be AF 2 887 07, where AF 2 means “Annals of Fulda v.2,” 887 is the Chronicle Entry in which the passage occurs, and 07 denotes this as the seventh distinct narrative unit in the entry. We tag the text of the Passage for persons and places (the only use we make of TEI or text-tagging).
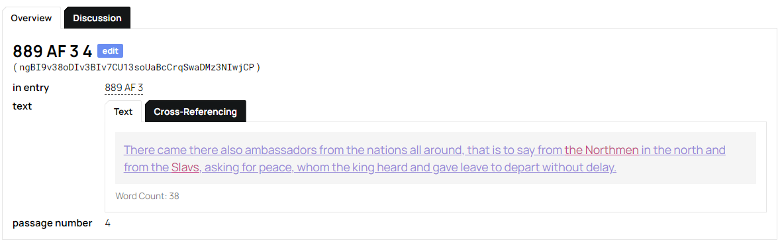
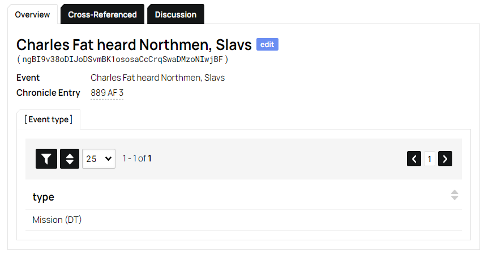
Event is where our analysis fully enters the picture. Here we give each Passage a label, in Latin (and translated into English for non-Latin-literate users). The Event name is based on the grammatical phrase which we have isolated as the focus of its narrative. The Event name uses the actual Latin of the text (whenever possible) to designate the central event of a passage. For instance, Celum Apertum is the event name for the 14th passage under 887 in the third version of the Annals of Fulda (or, in our shorthand: AF 3 887 14):
Et mirum in modum, usque dum honorifice Augensi ecclesia sepelitur, celum apertum multis cernentibus visum est, ut aperte monstraretur, qui spretus terrenae dignitatis ab hominibus exuitur, Deo dignus caelestis patriae vernula mereretur feliciter haberi.
If it is helpful, we have also considered calling Event instead Episode. Finally, we give each Event one (or in extreme cases of ambiguity, two) Event Type labels.
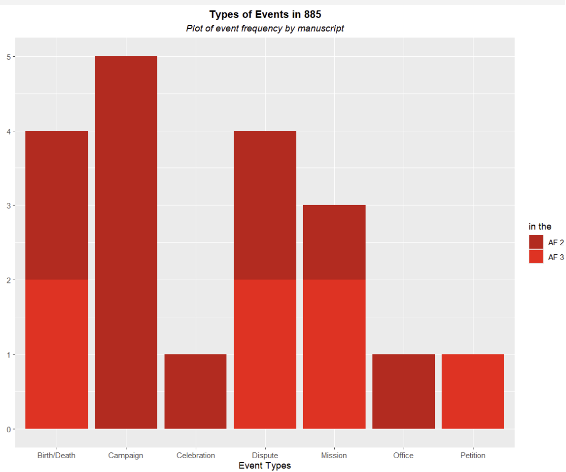
The following extended paragraph explains our use of the Event Type (if you are not concerned about it, feel free to skip down), which is not in fact central to our analysis or project. The important point is that these are helpful to our analyses, but they are not what we are analyzing about the chronicle texts. They are imposed analytical categories, which is why we have made them a distinct part of the database (it is possible to study the text without using these types as an analytic). At the same time we have taken great care and gone through many different versions of these through extensive internal debates before settling on a list of eleven. We have found this list to be sufficient for capturing the different sorts of events which the Annals of Fulda uses to fill out its annual entries. These are: Campaign, Birth/Death, Office/Succession, Meeting, Assembly/Council Travel/Embassy, Dispute, Celebration, Construction, Commentary, Phenomenon (note, this is what we assigned to AF 3 887 14, above). It needs to be understood that the Event Type is also NOT the goal of the analysis. These distinctions allow us to identify potential similarities between texts or between entries. In the future they will allow us to make some overall statements about about entries (i.e., an entire year’s entry), or about trends or emphases in different texts as a whole. But ultimately they are simply an analytical tool to understand the text, rather than being core to our argument about the text. All of this follows a central tenet of our database structure: to keep our analytical work (in the Passage and Event and then Event Type datasets or objects) separate from the digital text itself (in the Chronicle and Chronicle Entry datasets).
Welcome back. The key to our analytical interests—and so our intervention into the text and the history of the text—is the combination of Passage and Event.
Our data creation and analysis thereof is based on the following premises. Chronicles (chronographic, chronological, and annalistic texts) are rarely attributed to a single author, and even when they are they are rarely the product of (a) a single moment and/or (b) a single person’s unique assemblage of information. Chronicles are much more often (1) collective, collaborative enterprises; (2) written over long periods, re-written, both, and more; and, (3) compiled from excerpted, rewritten, partially rewritten, and/or orally-transmitted pieces of information. As a result, what interests us as historians is not a textual-originalist (i.e., the Historical-Critical Method) approach which seeks to reproduce the text as it emanated from the quill of its author-scribe. Rather, what interests us is whatever happens to be the social conditions of the production of the text. This has led to our analytical interest in two things:
- any and all informational overlaps between extant versions (i.e., down to the variant manuscripts) of any chronicle text, since each of those overlaps indicate to us shared knowledge
- shared knowledge in turn indicates the social networks through which that knowledge was shared
Our relational database has shifted its structure over the past two years to allow us to get greater access to these two aspects of the evidence we find the text contains. What we have learned from observing the flow project is to identify where digital tools are and are not useful for this study. Thus far they are useful in two areas: (1) tagging persons and places in each Passage through Named Entity Recognition (nodegoat’s built-in internal process for this is “reconciliation”); and, (2) analysis and visualization of the “informational overlaps” and “social networks” noted above. In the near future we will add (3) Handwritten Text Recognition to our workflow when we turn to using the actual surviving manuscripts for our Latin text rather than the printed critical editions (which we continue to use as we build our database model). Identifying our unique ‘digital flow’ emphasizes how much our work remains tied (by the necessity of our own standards of exactitude) to careful reading practices, double- and triple-checking all of our data as we proceed.
At the time of the IMC Leeds presentation we were able to offer the following.
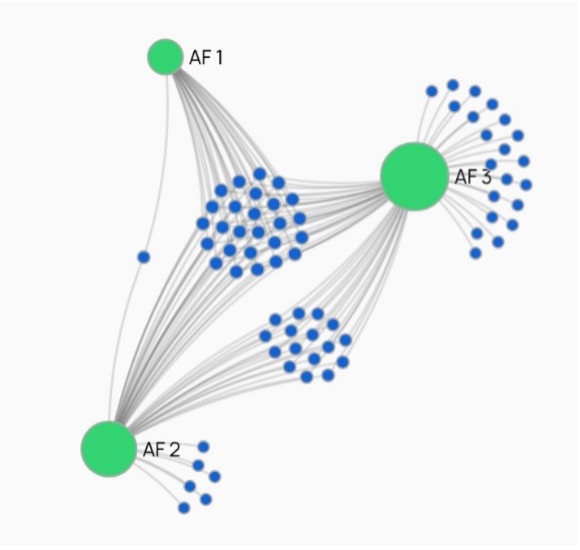
Having conducted an initial analysis of three different versions of the Annals of Fulda (AF 1, AF 2, AF 3 in our representation), we were able to display the overlap of the entries in each of them (i.e., where the entire text for a year was the same) in the following image.
AF 1 shares all of its entries with both AF2 or AF3, which in turn share a number of their entries with each other but then possess their own distinct entries. This is simply a visualization of the text history as manifest in the MGH critical edition.
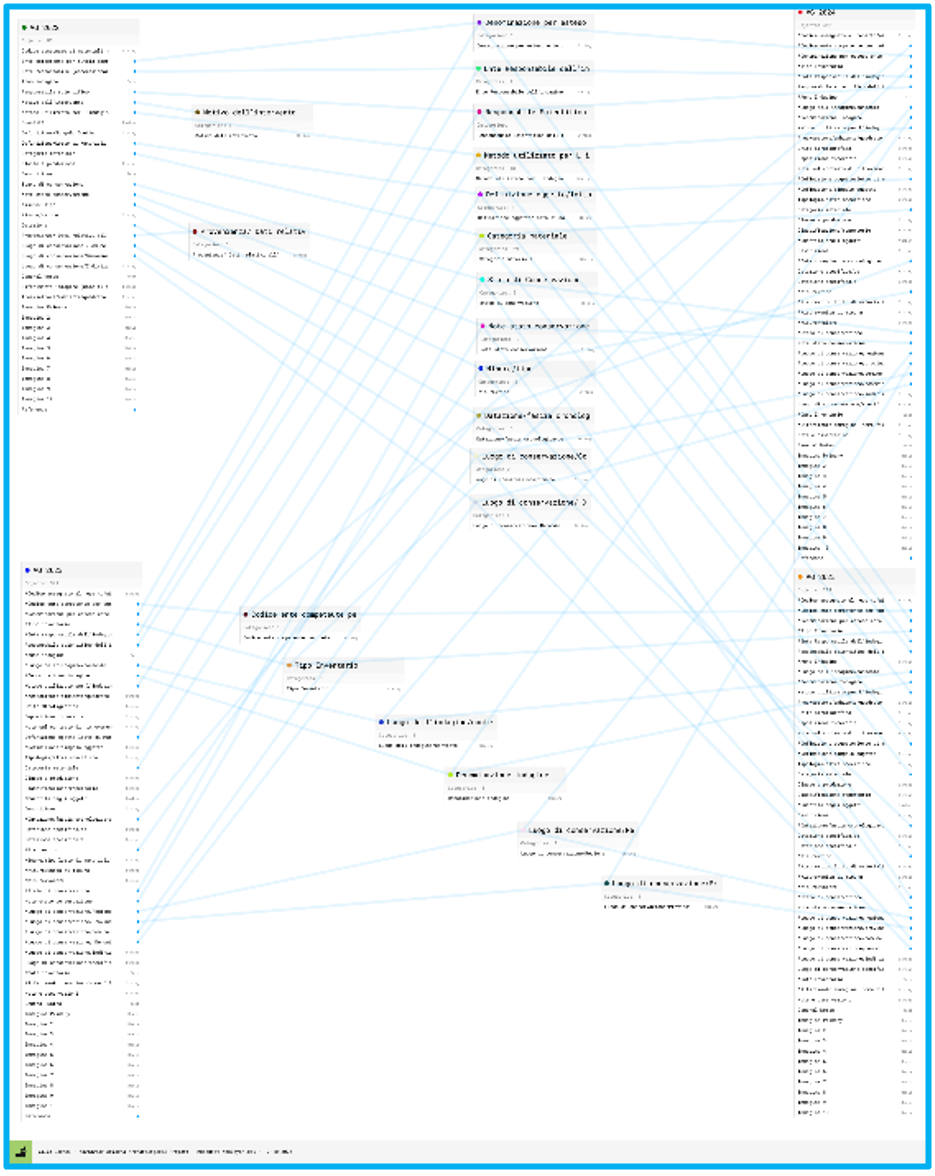
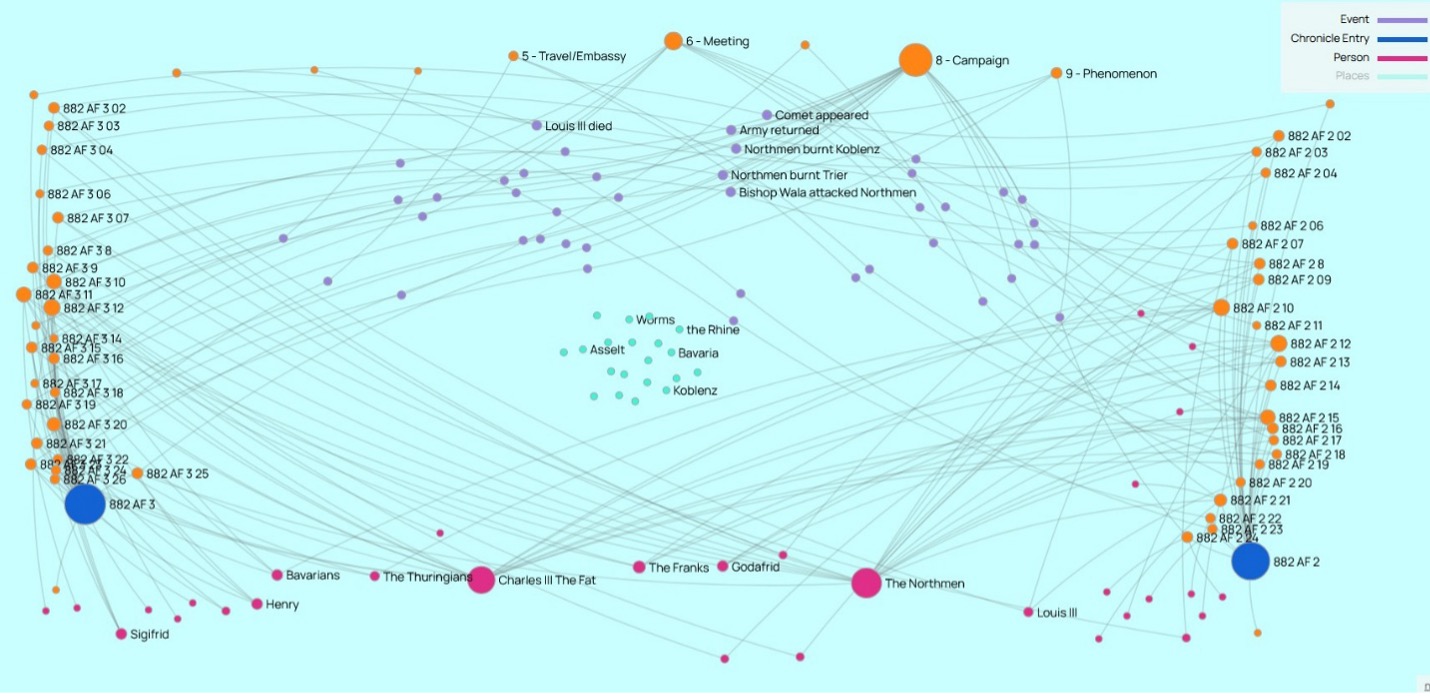
What our Comparing Chronicles methodology does to the text is visible in the next image. This is a comparison between the entries for 882 in AF3 (to the left) and AF2 (to the right), which are each represented by the large blue nodes in the bottom corners.
The orange nodes clustered in descending numerical order on the left and right sides each indicate a discreet Event (i.e., narrative episode) in each text. We have activated the persons (bottom, pink) and the Event Types (top, orange) but de-activated the places (blue, floating in the middle) of each version to make it possible to see the encoded relations.
The key element of interest, above, for our purposes are the six Events (purple) where the visualization displays the labels (in English here, rather than in Latin) of the events which we noted as the same event. That is, these five (“Louis III died,” “Comet Appeared,” “Army Returned,” “Northmen burnt Koblenz,” Northmen burnt Trier,” and “Bishop Wala attacked Northmen”) we read as the same core episode even in the text describing or narrating each was different in each text. In numerical terms, AH2 has 18 distinct Events, AH 3 has 20 distinct events, and they share 6.
According to the Historical Critical Method, these are completely divergent textual traditions. According to our Comparative Method, this single year’s entry in each text possesses evidence of a 23-25% overlap in the knowledge network between these two textual communities, as recorded in their respective annals. This is already an exciting an promising result, just from this small test case.
In this upcoming semester we will be applying our most updated methodology to an encoding of a combined Latin-English database of the three versions of the Annals of Fulda, while also applying this same methodology to the Annals of St. Bertin. This work will give us our final methodological prototype, making it possible to visualize what the evidence from a surviving text of a single knowledge network looks like—even when there are three versions of the text spread out amongst the sister monasteries of the monastic house of Fulda—as compared to a distinct knowledge network, that of St. Bertin.
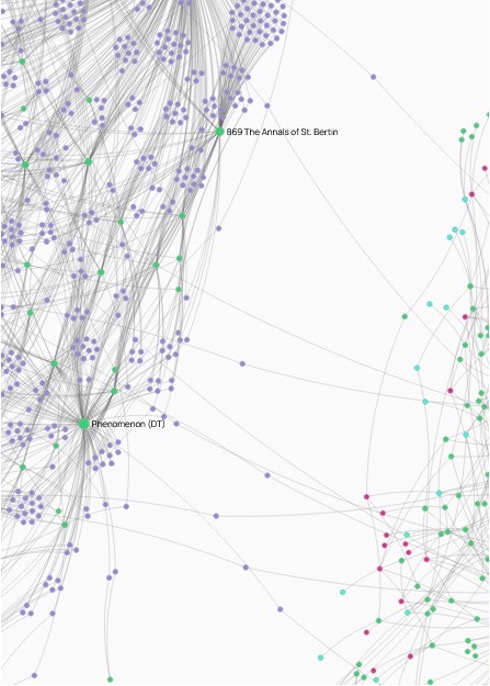
However, our final visualization gives a hint of what is in store. This is a detail from the social network of the Entries and Events in both the Annals of Fulda and the Annales Bertiniani. While these networks are clearly distinct, the Events (in purple) which hang like spiderwebs between the two clouds indicate events which are the same episode. Our methodology already allows us to see that even though these are distinct textual traditions, there are meaningful links in the historical knowledge which they shared and recorded in common.
|