

During the summer of 2026, student Matthew Thomson (’26) worked with Professor Torgerson on the Comparing Chronicles project through a QAC (Quantitative Analysis Center) summer apprenticeship. After about two weeks of cleaning Comparing Chronicles’s data on the Annals of Fulda in nodegoat, he experimented with methods of determining whether two “events” mentioned in different manuscripts are the same using our data and python scripts. He also used python to create visual representations of the data, creating novel “subway maps” to represent how manuscripts share events, and regular maps for animating locations mentioned in Fulda over time. Finally, he integrated all of these scripts with the nodegoat API so that they can automatically run on the most up-to-date data.
Background on Comparing Chronicles
The Comparing Chronicles Project in Wesleyan’s Travelers’ Lab seeks to rethink medieval knowledge networks—how information traveled and spread—by developing new methods to identify shared information between Carolingian chronicles. The Carolingian Empire, a large early medieval state covering much of Western Europe, recorded its history in Latin chronicles, terse, year-by-year accounts consisting of straightforward lists of what took place. This poster examines the Annals of Fulda, a family of ninth-century chronicles that often describe the same historical events using language that may be slightly different, completely different, or exactly the same. Whereas traditional methods of textual analysis frequently seek to correct these differences in pursuit of an “original” text, the Comparing Chronicles Project instead looks past them by treating shared events, rather than the texts themselves, as the fundamental unit of analysis. By separating these events from their different textual representations, we can compare chronicles without privileging any one version of the text, producing new visualizations and quantitative analyses of the information shared among Carolingian chroniclers.
Data Creation Methodology
The Comparing Chronicles Project began by dividing each of the three manuscript groups, or versions, of the Annals of Fulda into short passages representing a single historical event using Nodegoat, an online platform for relational database management. Within the text, an event appears as a discrete narrative unit with a clear beginning and end. Consider the following example:
Charlemagne invaded Saxony, and then he defeated the Saxons in battle. The winter was long and bitter.
This entry contains three events:
- Charlemagne invaded Saxony,
- and then he defeated the Saxons in battle.
- The winter was long and bitter.
Our methodology assumes that chroniclers first decided which events to include and only afterward determined the wording and details of their accounts. A passage in another manuscript, such as “A difficult winter occurred with many hardships,” would therefore be linked to the same event object as “The winter was long and bitter.” Distinguishing the shared event from its different textual representations allows us to separate decisions about what to record from decisions about how to describe it.
Each event was then assigned one or more of twelve types, such as “Birth/Death” or “Meeting,” while each passage was tagged with the people and places it mentions. This process was complete during the summer of 2026, providing a complete dataset of the Annals of Fulda.
Graphing Chronicles
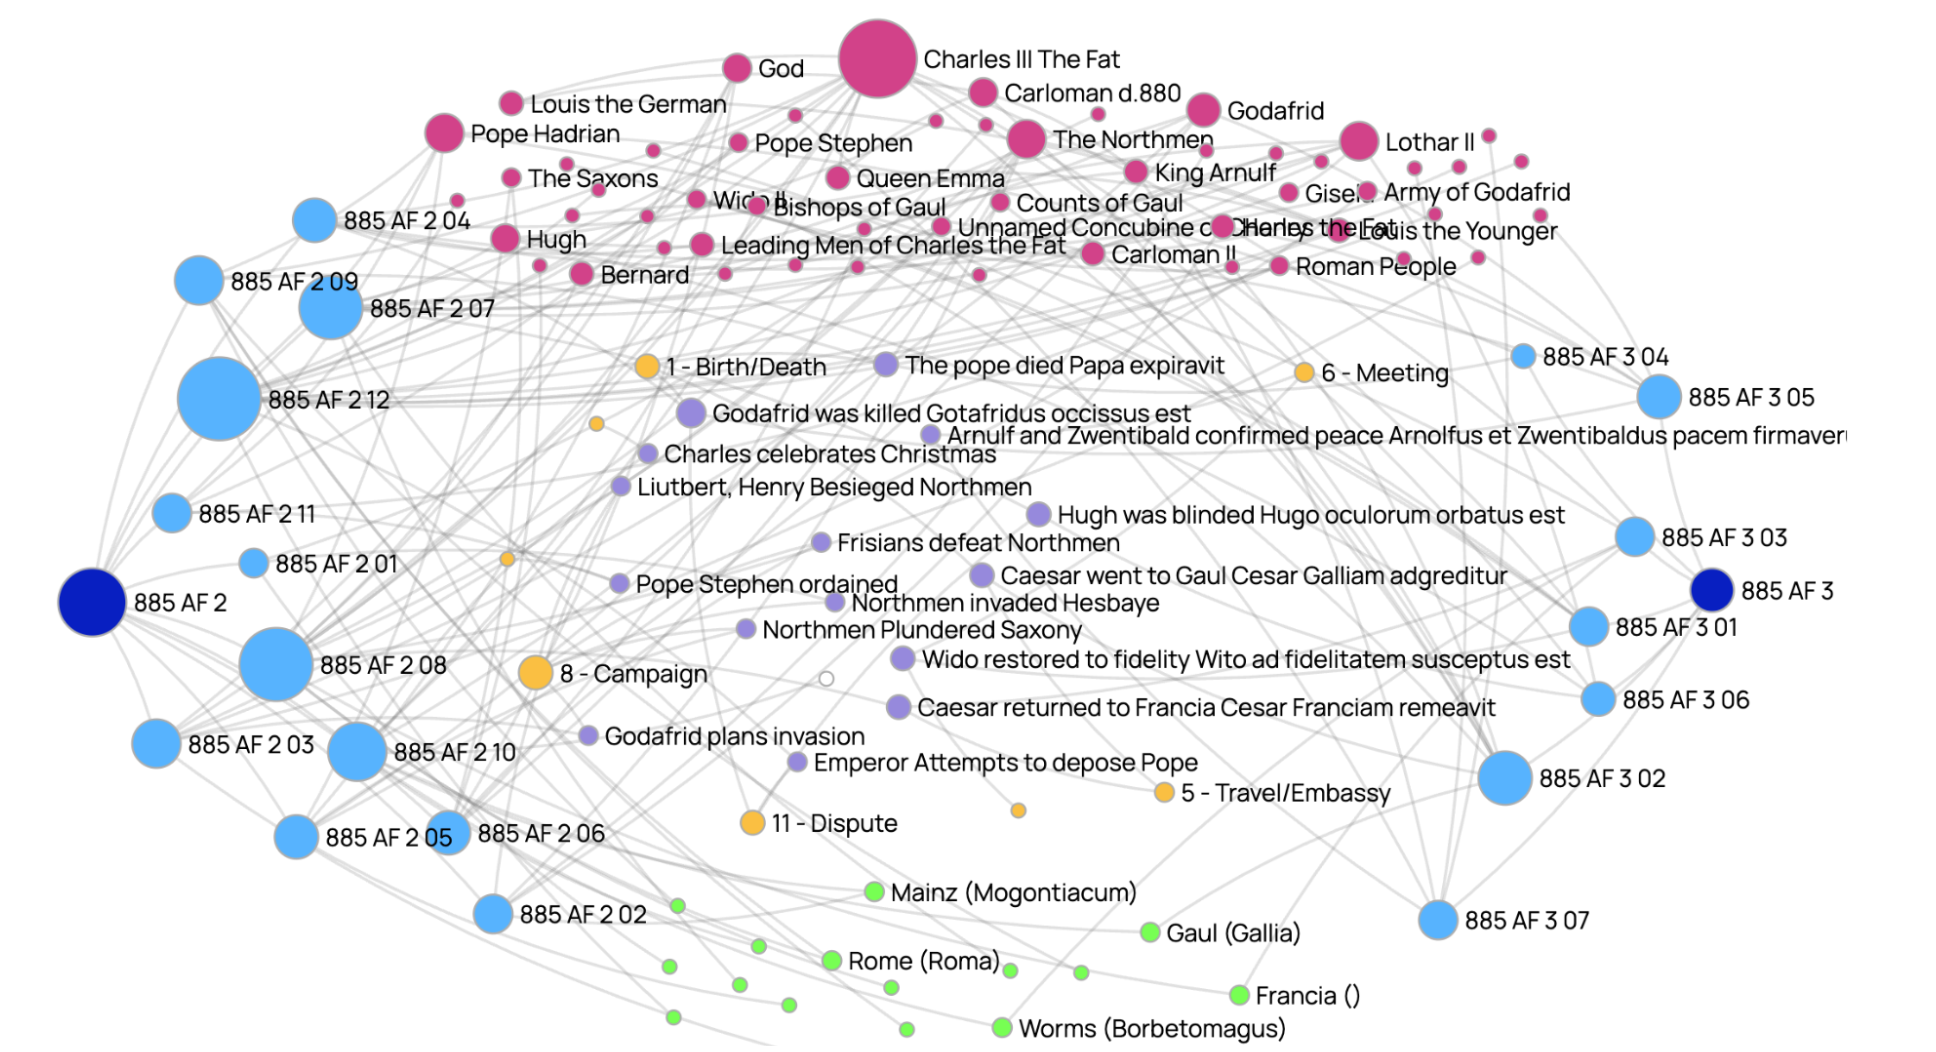
Our event-centered data model forms a knowledge graph linking chronicle passages, events, people, places, and manuscript groups. Events can be linked simultaneously to multiple passages, while each passage retains its own manuscript group, year, and position within the narrative. Shared events, omitted events, changes in emphasis, additions of detail, shifts in geography, and differences in narrative structure can therefore be represented as graph relationships rather than treated as problems of textual disagreement. The resulting network models not only the Carolingian world as described by the chronicles, but also how historical information was selected, transmitted, and transformed across chronicles.
Summer 2026 Progress
Data Cleaning
The data cleaning tasks Matthew accomplished this summer are listed here. Most of the cleaning involved bringing all of the data up to established standards, picking up from the work of Chika Simon (’26) and Diana Tran (’26) during the previous semester and early in the summer. Additionally, many passage/event divisions were redone to ensure that each passage contains at least one Latin main verb and is linked to exactly one event.
One major change was the division of entry and passage objects so that each object corresponds to exactly one of the three manuscript groups. Previously, manuscript groups were usually linked to the same entry and passage objects when the text matched exactly. This change was accomplished using a python script and the nodegoat API.
Event Sameness and Subway Maps
The “subway map” was developed this summer as a means of visualizing how different chronicles or manuscript groups diverge and converge by covering the same or different events. Each chronicle is drawn as a colored line that travels between passages, represented as stations. When two passages are determined to describe the same event, their lines intersect at a shared station. Because the method compares chronicles using different definitions of similarity, the same pair of chronicles can produce very different maps. The examples below compare two chronicles using three increasingly flexible approaches to passage pairing. As broader notions of similarity are used, the chronicles appear progressively more alike, revealing shared historical knowledge that would be obscured by textual comparison alone.
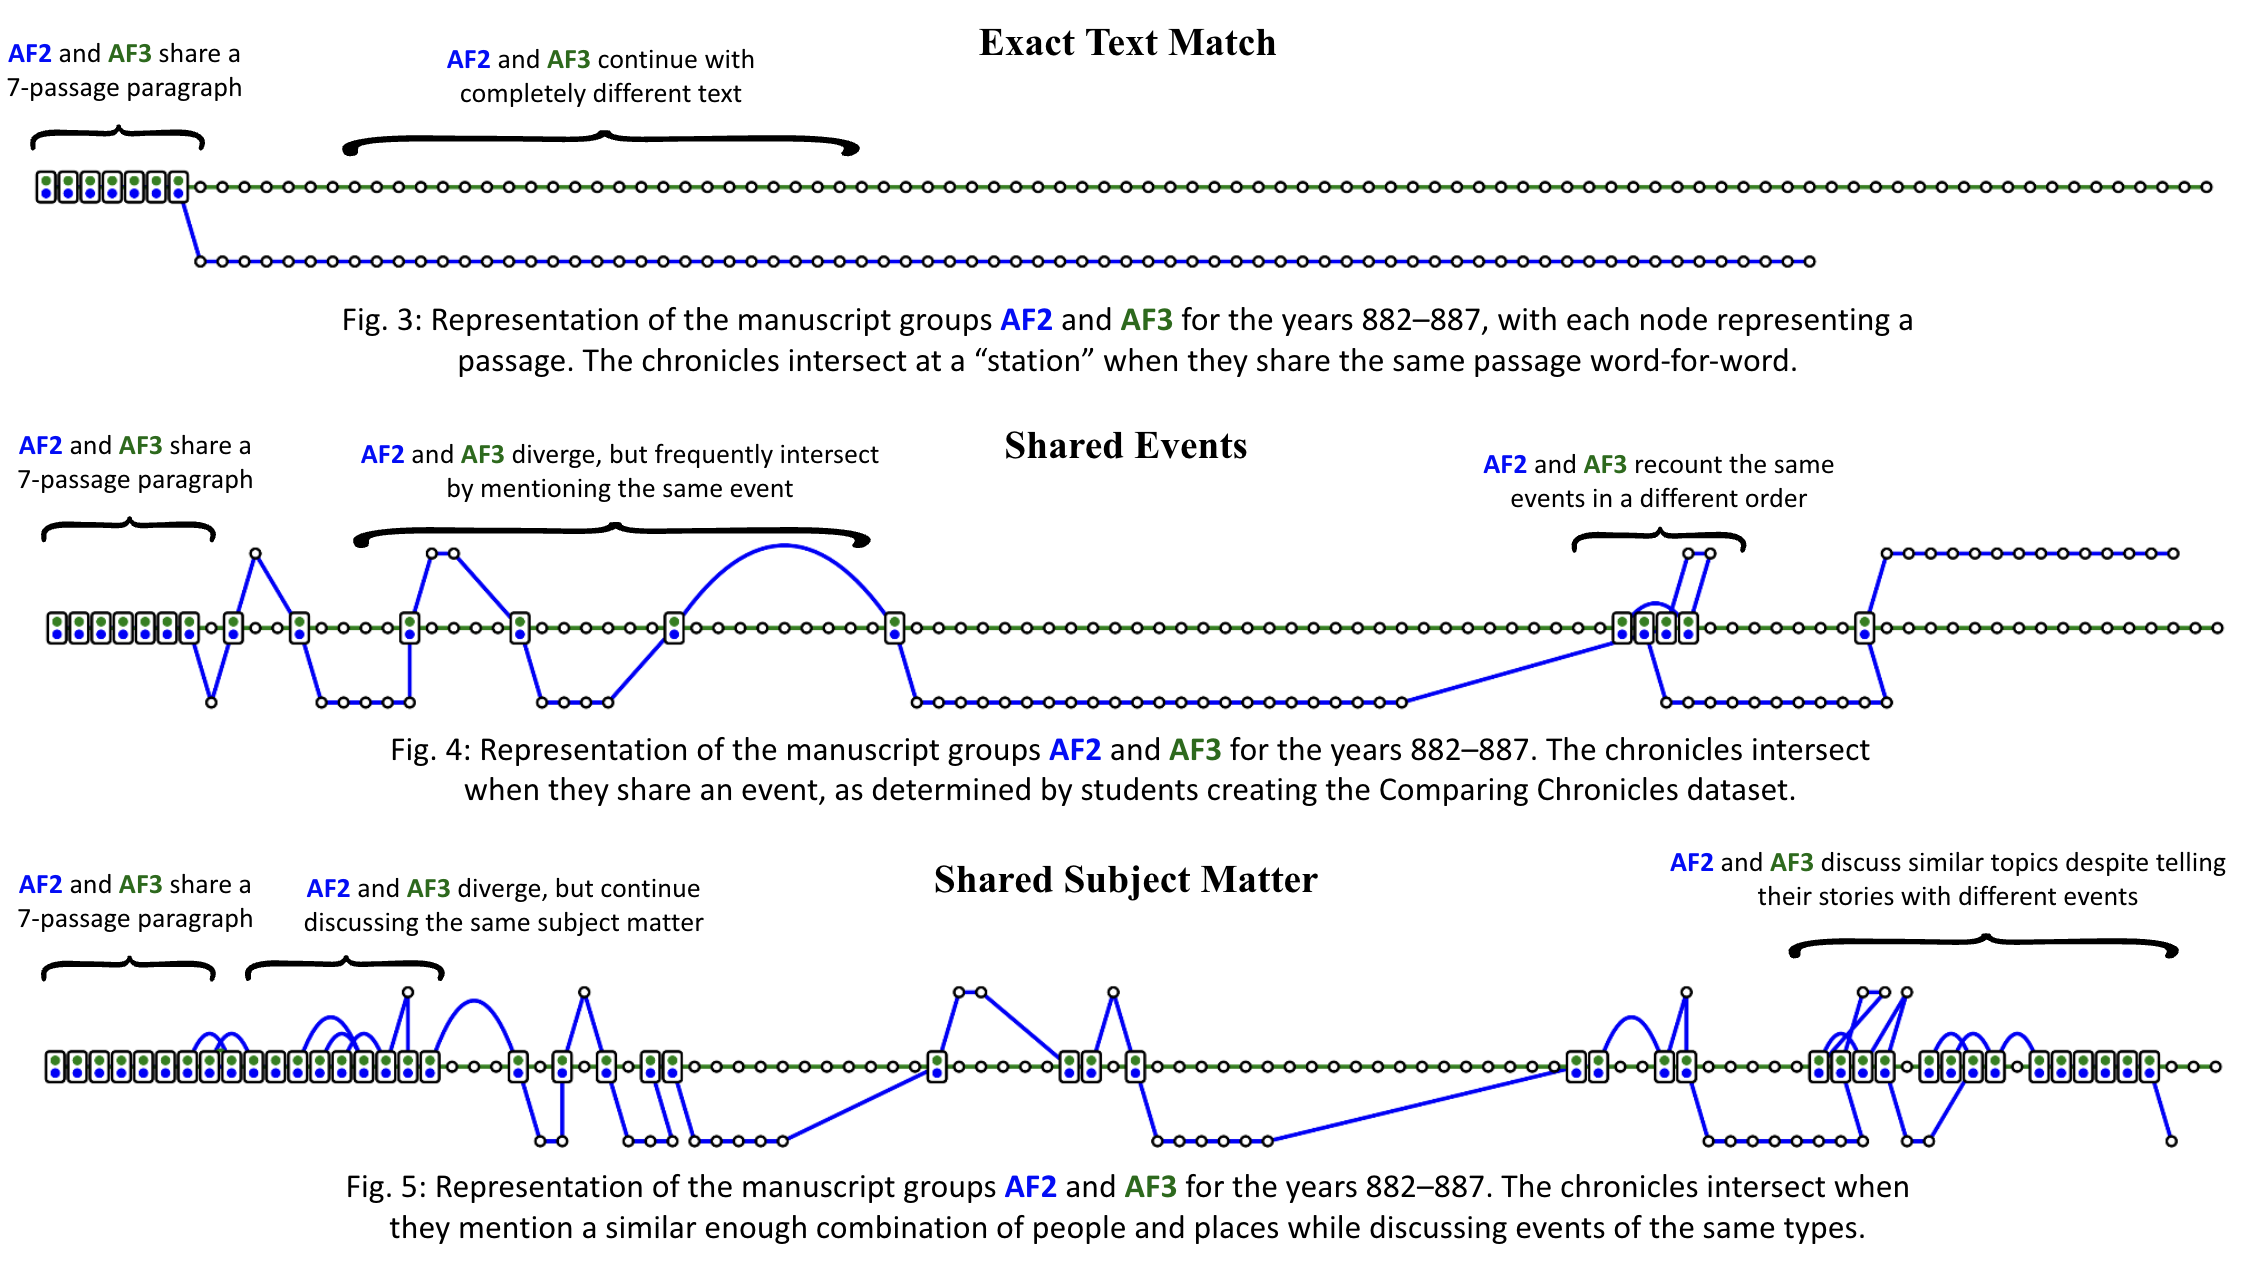
These maps were created by a python script that reads the nodegoat data, un-matches all events, and re-matches them based on some specified methodology before making the final graph. This way, the data itself is not bound to any one definition of “sameness,” and we gain access to all of the different insights different notions of sameness can provide into the chronicles.
Playing with Maps
Comparing Chronicles’s data contains coordinates for all locations mentioned in the Annals of Fulda. These data were mapped for the first time this summer.
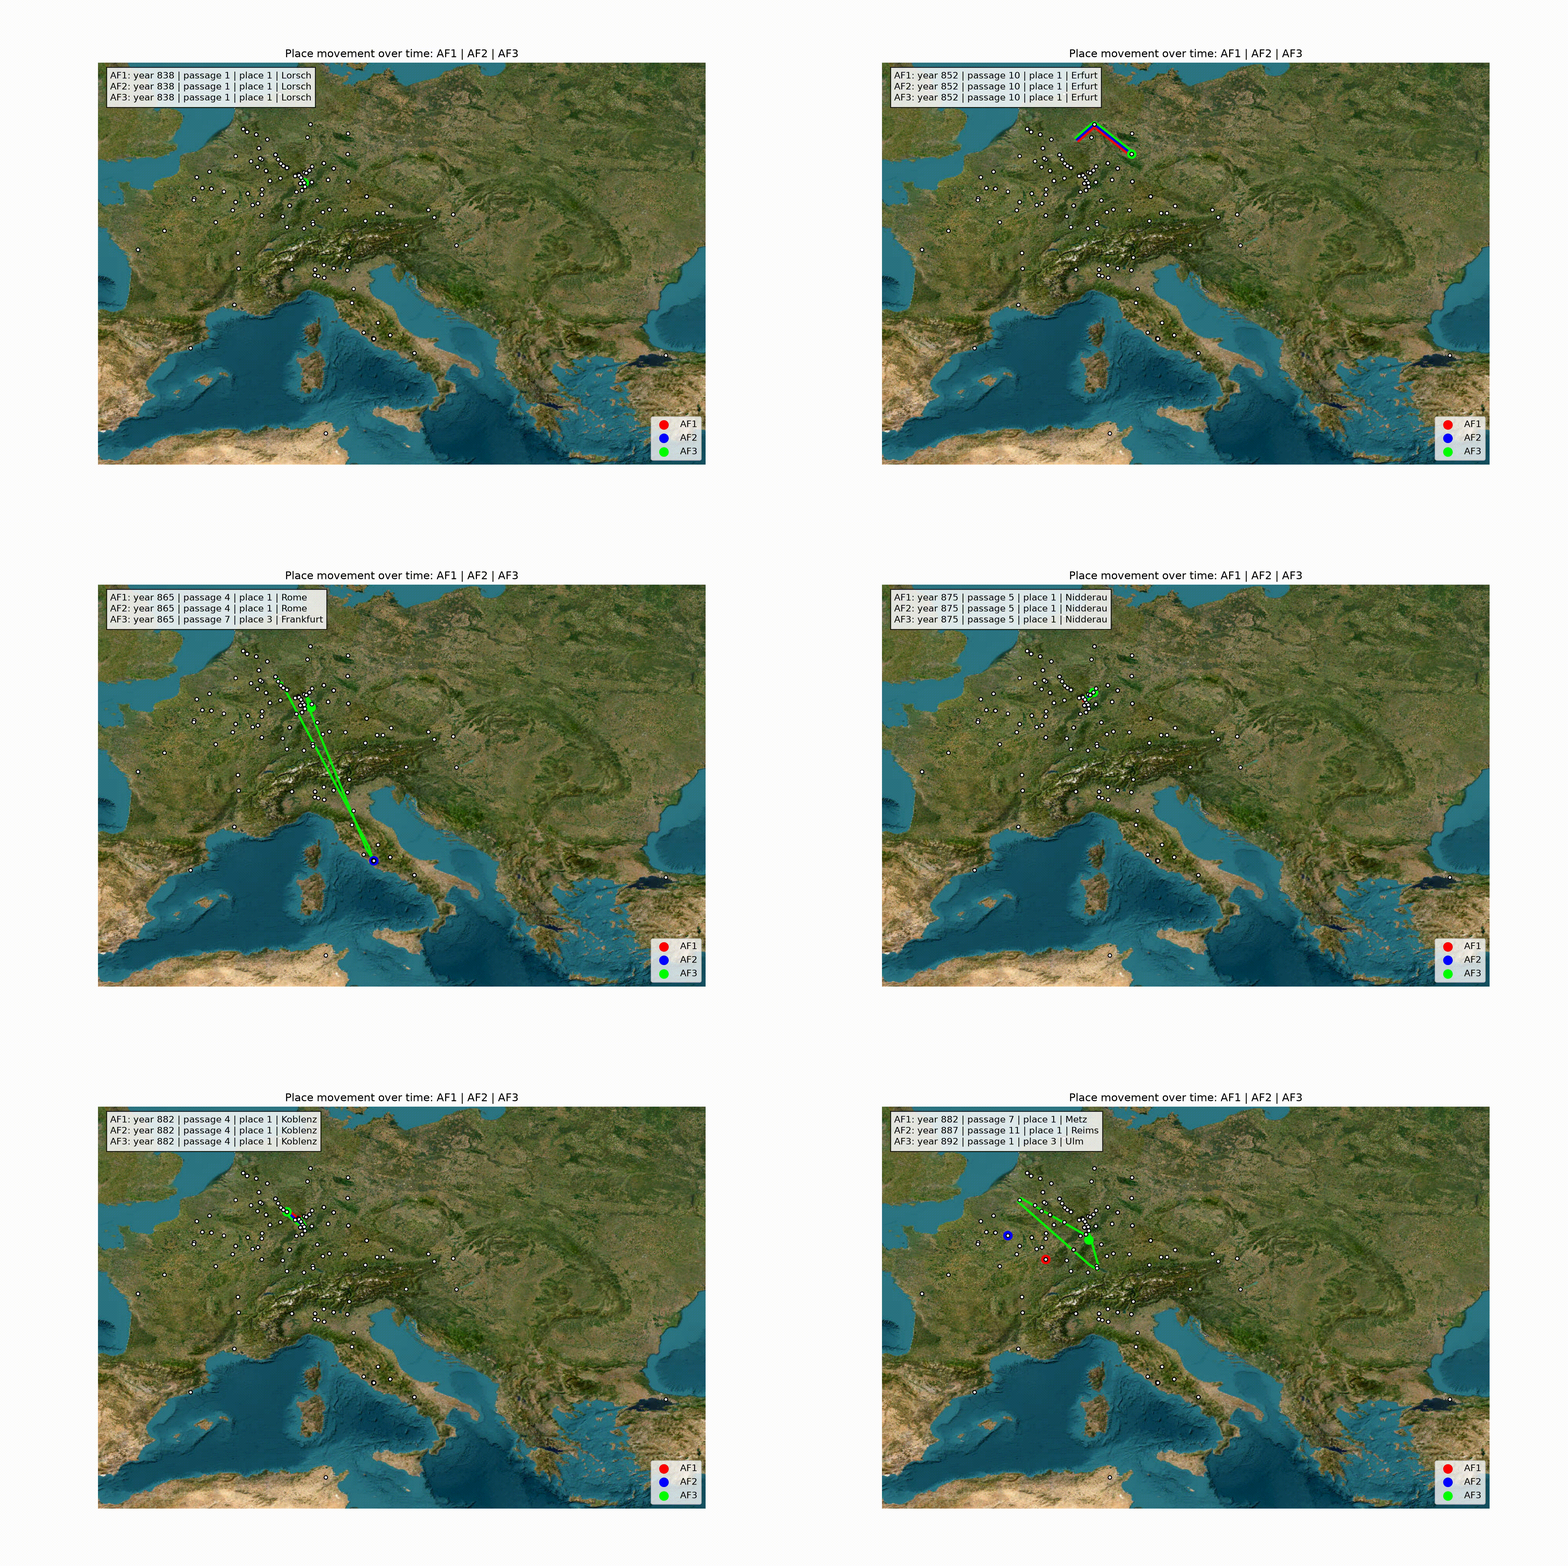
The above map animation shows which points are mentioned over time in the Annals of Fulda over the years 838–901. Each of the three manuscript groups, AF1, AF2, and AF3, are represented with a different color. Note how, in 882, AF1 ends while AF2 and AF3 diverge completely; this same period is represented in the subway map examples above.
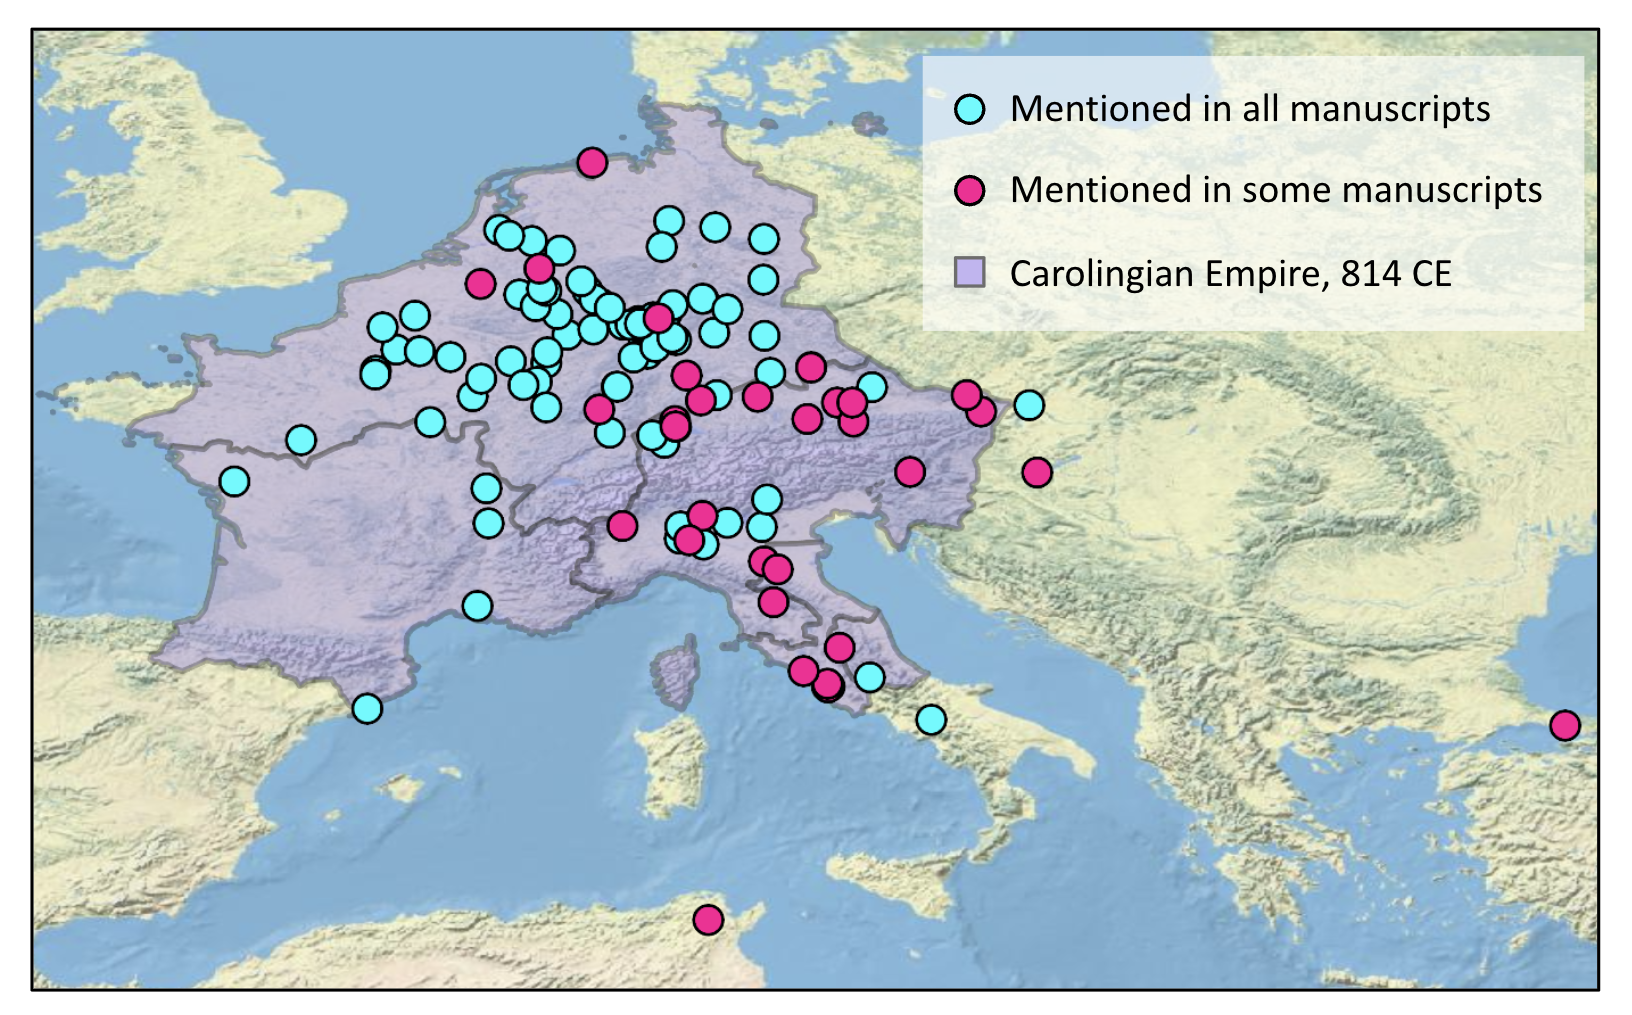
The above map shows all locations mentioned in the Annals of Fulda, distinguishing those mentioned in all manuscripts or only some manuscripts. While the former category is concentrated around the Carolingian Empire’s core around the Rhine river, the latter, shown in pink, is more concentrated in the east and Italy. This discrepancy comes from the continuation of AF3 from 882–901, which was probably composed in Regensburg, Bavaria, in the Empire’s east.
Scripts and API Integration
The python scripts that determined event sameness, and created the subway maps and geographic map animations have been placed into a single folder here. All of the scripts use the same input data, which can automatically be updated from the nodegoat through a script that uses the nodegoat API.