One of the biggest discoveries of the past year for me was the trove of documents available online through the activities of Internet Archive: there is a variety of books from the 19th and early 20th century, scanned, converted into pdf, and even into plain text form (after Optical Character Recognition – OCR – was done on them). With text available as txt file, it would seem easy to apply various text mining tools to extract information. This easiness is deceptive: the technology used to recognize text gets in the way. This summer I was working on extracting text printed in the margins of John of Gaunt’s Register. This was part of Gary Shaw‘s project on the travel of bishops in medieval England. Below is a summary of the problems I discovered and the solutions I applied.
Problem 1: assumptions of columns in text
When consumer-level OCR systems appeared on the market in early 1990’s, one of their early accomplishments was identifying block structure of a page and incorporating it into the recognition process: a program would detect where the text starts, ends, if there was an image in the middle, and if there were columns in the text. This process is so ingrained now that a user is not even given an option to specify any arguments. Applied to a page with additional text in the margins, this can lead to erratic results.
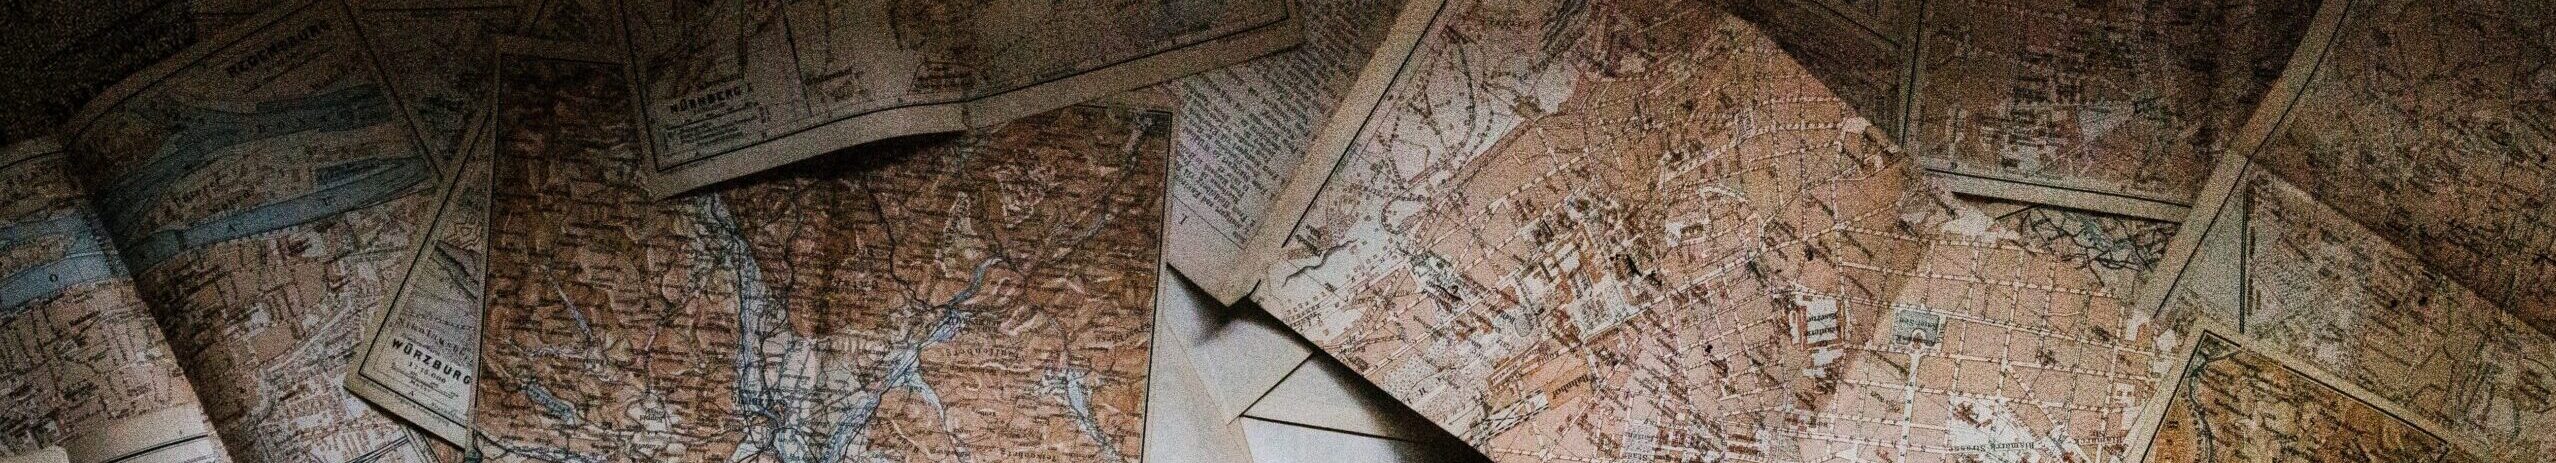
As an example, below is the JPEG image of page 5 of the Register. The original text of the Register is in French and is in the main body of the page. In the margins is additional information, in English. Each section of text has a unique number, printed in bold. Throughout the section, there are notes on the dates and locations visited by John of Gaunt. Thus, for section 7 we have an entry “7 January 1372 Kingston Dorset”.
(One of the things that the authors of the margin notes did was convert the years: the original text identifies 1372 as “l’an du regne le Roy Edward tierce puis le conquest d’Engleterre quarant quint et de France trent et seconde.”)
Next to the source image is the screenshot from a text editor, showing the text that is provided by the Internet Archive. Notice that the first note (“15 January 1371 Montpont”) occurs at the right edge of the lines, but the second note is placed at the bottom of the page. This has occurred because the OCR software classified the second note as a separate column of text that must be placed at the end.
|
|
|

For comparison, the next two images are screenshots of OCR results for the same page done in Adobe Acrobat and exported as Excel spreadsheet, and in Mathematica v. 11. Both systems detected only one column of text: all margin notes are embedded at the end of lines of main text.
|
|
|


Problem 2: erratic text recognition
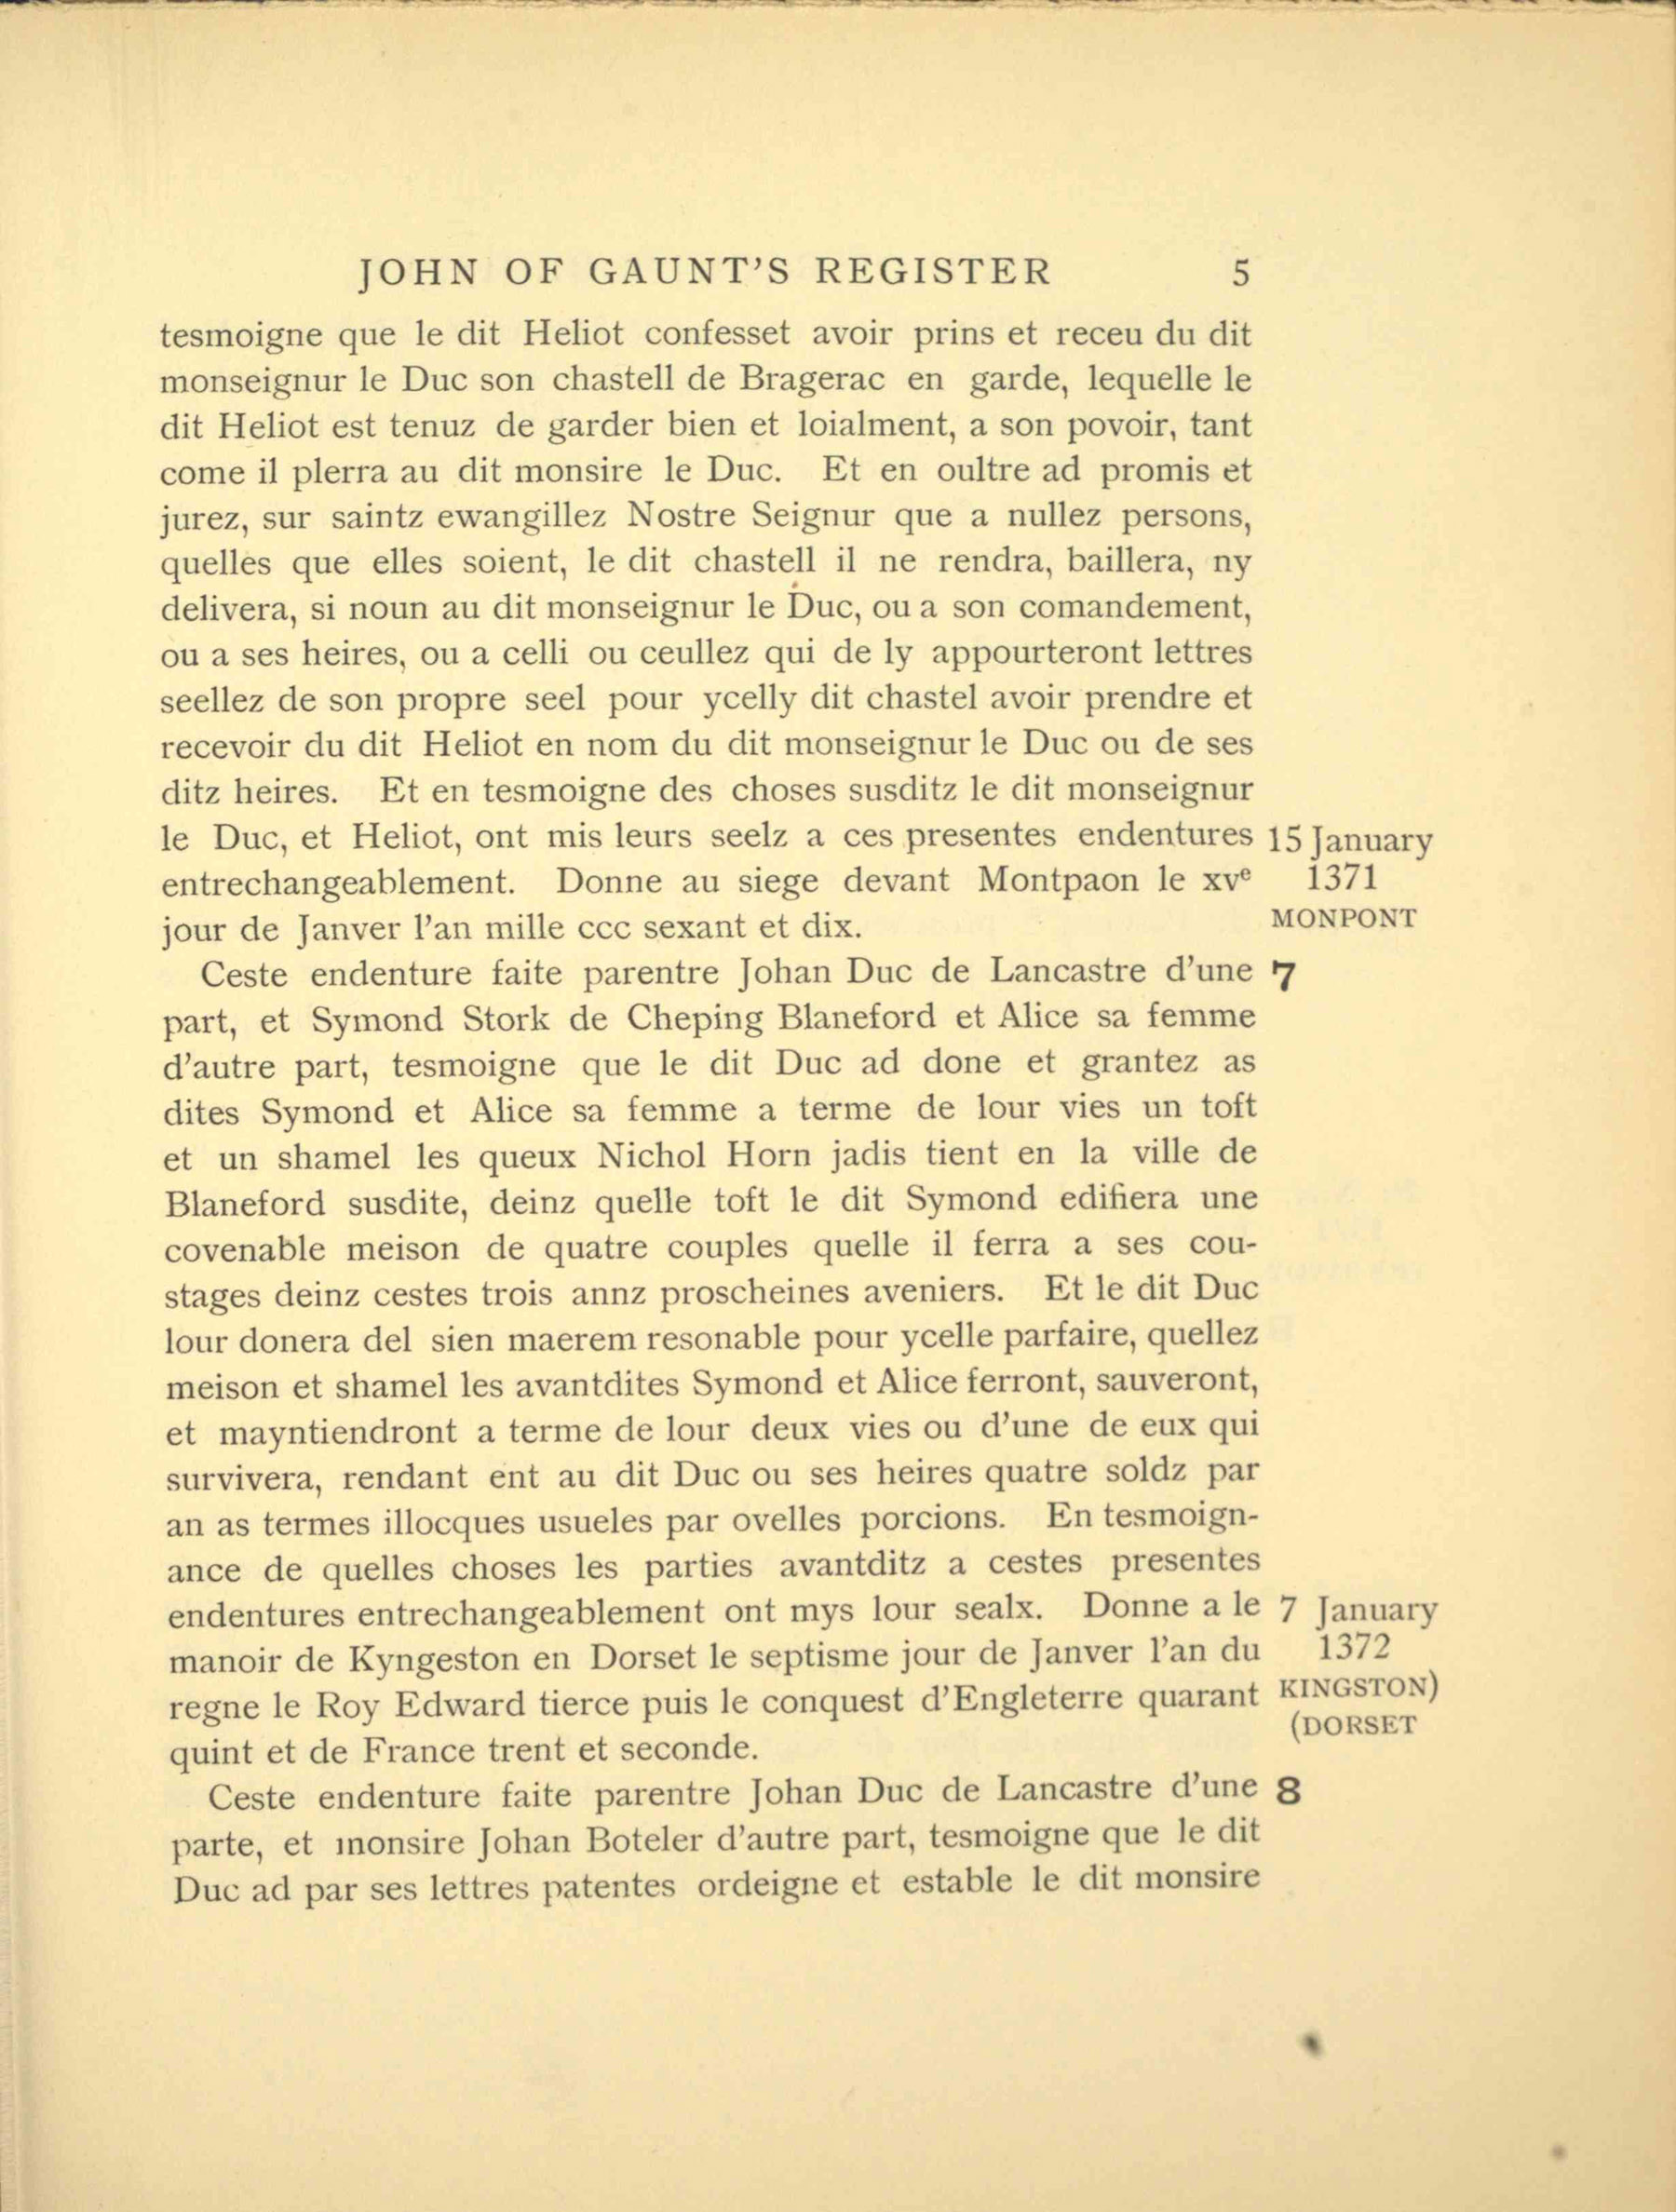
If you look carefully at the image with OCR results from Adobe Acrobat, you will notice that the spacing between letters varies: there is a space between ‘J’ and ‘O’, but no space between ‘G’ and ‘A’. This is just an inkling of serious problems hidden in the OCR process itself. Even the simple phrase “JOHN OF GAUNT’S REGISTER” (useful for identifying where pages start and end within the flowing body of text) gets misrecognized in multiple ways. Extra spaces, right bracket ] instead of letter J, placement of text on multiple lines: if you can think of it, it probably has happened and can be found in the text. Below is a small table showing just a few outcomes:
This presents a pretty serious problem for pattern matching in text using regular expressions: essentially, we have to create a separate pattern for every possible outcome. What’s worse, the need to create a new pattern becomes obvious only after we run pattern matching on all pages and then try to detect which ones we did not get (by listing recognized page numbers and seeing which ones are missing, for instance).
In addition to extra spaces and miscrecognized characters, there were additional problems that I attribute to the fonts used in the book. Some numerals (for example, 7) would often be missed altogether, while others (3, 6, 8) would often be confused with each other. At the root of this problem, probably, is the fact that OCR systems do not really ‘understand’ text: they perform a classification task – assign observed image to a specific outcome/character. As such, if a specific glyph (a graphical representation of a character) was not used in the training of the system, then very likely this glyph will be misclassified or completely ignored as noise. Some systems run a spell-checker on top of OCR results as an extra protection to catch such errors, but if a string consists of a stand-alone numeral there is nothing that would tell the system whether the number was recognized correctly or not. John of Gaunt’s Register was published in 1911 in England, and the text layout and fonts have changed since then.
What can be done to alleviate these problems? Back in the summer, I was experimenting with Google Cloud services and one of them is Google Vision API, which classifies images and can also recognize text in a photograph. I decided to use it for more targeted text recognition. Since then, I learned that new versions of Mathematica come with built-in OCR functions, but back then my first choice was to use R. The process, then, was to extract the portion of an image with margin notes and submit it to Google Vision API via online request from R.
Solution 1: extract margins using image segmentation
For image manipulation, I used the R package imager, which supports import and export of JPEG files and operations on individual pixels in R. The idea behind extracting margin notes is straightforward: pixels in grayscale images are represented by an integer number from 0 (black) to 255 (white). Margin notes should have an empty space separating them from the main text. Thus, if we calculate mean value for each column in the image, we should see a spike in the area corresponding to the gap.
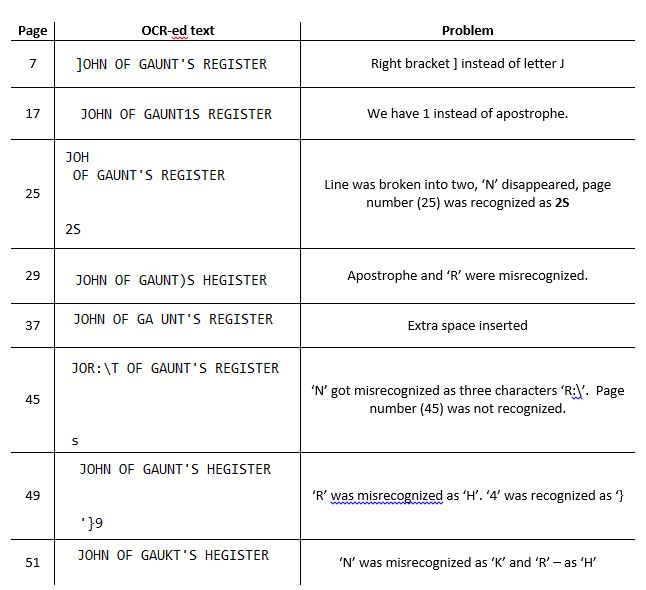
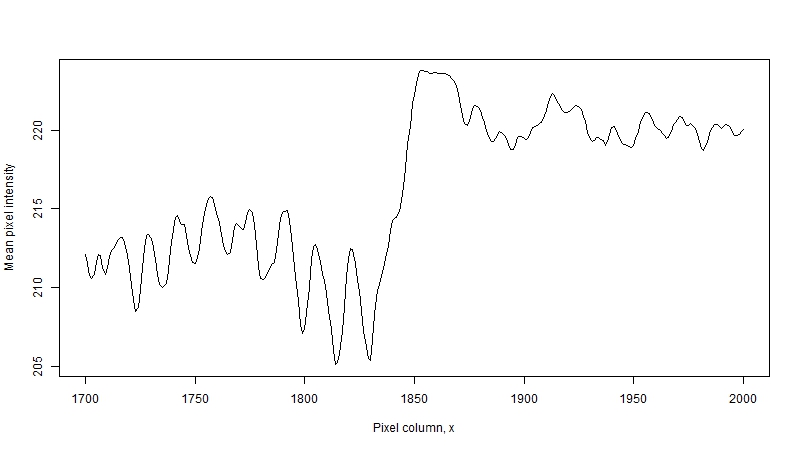
The image below is the plot of mean pixel intensity versus pixel columns for page 5 of the Register – same page used in the illustrations above. It was imported into R and converted into grayscale image. Higher values correspond to emptier columns, lower values – to ‘busier’ ones. The sharp drop in intensity around x=250 corresponds to the left boundary of the main text. The rise in intensity at x=1850 corresponds to the gap between main text and the margin notes.
The line around x=1850 shows another problem, not obvious at first, – the slopes are not vertical. This happens due to two reasons. The first is that characters are not solid blocks of black ink: for instance, if we look at glypth for 3 we would first get just two dark pixels at the left-most boundary of the glyph. The second is the un-evenness of the page: if you look closer at the image, you will notice a small slant: to make the text boundary completely vertical we need to rotate the image clock-wise about the upper left corner by a small angle. This un-evenness could arise either due to how the book was placed on a scanner when it was digitized, or it could be a printing defect introduced at the time of compositing when multiple pages were assembled on a sheet.
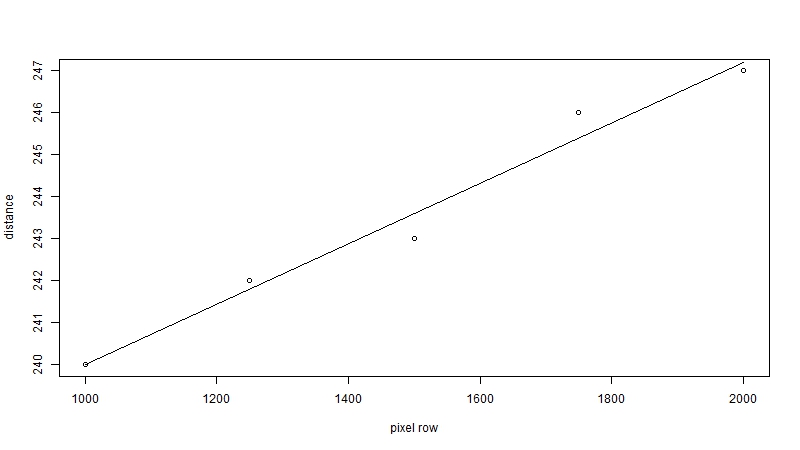
The angle of rotation is found using the well-familiar linear regression. Slope of a regression line y=a + bx is equal to the tangent of the angle between the line and the x-axis. In our case y is the distance from the left edge of the image to the start of the text, and x is the pixel row of the image. Trying to figure out how to fit this regression line made me realize the amount of heuristics that go into image processing software like Photoshop: measuring the distance for every pixel row is counterproductive, because some rows are empty – they are the spaces between character lines. These measurements, then, become outliers. Instead, a better approach is to use a band of rows (in my case, 500 pixels produced a good performance): the algorithm starts expanding the band right-ward, and stops when the average pixel intensity changes above a heuristically set threshold.
The chart below shows the process for page 5 of the Register. Based on the measurements, the difference between top-left and bottom-left positions of the text is about 7 pixels, which corresponds to an angle of 0.4 degrees: not a lot, but enough to introduce extraneous characters into a rectangular segment. After rotation, the slope of the pixel intensity line around x=1850 is more streamlined, which would indicate that the edge of characters is now veritically aligned.
|
|
|

The final step is to determine the boundary of the image segment. Depending on the preferences, I could have used a heuristic (e.g., “find the first large increase in pixel intensity in the area x > 1500), but the challenge is that sometimes the increase is not that large due to noise in the image: for instance, in the left plot above the slope is over 50 pixels wide. In the end, I used wavelet analysis. Wavelets are functions of specific shapes that are fit onto the curve at successively smaller scales. They can be used to approximate the curve, or to highlight areas of abrupt change. (As a digression, MPEG compression uses rectangular wavelets and you can notice them in an online movie images when the transmission bandwidth suddenly becomes smaller.) I can hardly do justice to the topic myself. The American Mathematical Society has put together a very nice web tutorial explaining the mathematics and applications of wavelets, which I heartily recommend.
Solution 2: use the OCR from Google Vision API
After I extracted the segments with margin notes, the next task was to do the optical recognition. As I mentioned earlier, Adobe Acrobat has built-in OCR: in order to use it, you would create a new PDF file from a JPG file (File->Create->PDF from file…), and then do Export to->Spreadsheet->Microsoft Excel Workbook. The result will be saved into a spreadsheet, and Acrobat even will try to preserve the formatting (font size, etc.) In the end, however, Acrobat was less accurate than Google Vision. For instance, if you have access to Acrobat, download the file below (this is the margin of page 9) and do the conversion. In my case, Acrobat completely ignored the word Bordeaux under 1371. Google Vision API, by comparison, recognized every word in the image (see the R output below).
|
|
|
|


Conclusion
Considering that the amount of notes from the margins was not especially large (in total, we processed 800+ pages from two volumes of the Register), a reasonable question to ask is “did we gain anything that could not be done manually?” The answer is a strong yes. Being able to examine, with pixel precision, layouts of pages opens up the possibilities of doing “print forensics” – exploring evolution of technology of printmaking. Looking at the edge of typefaces under high resolution can give insights into the inks and paper used in the process. And we have learned, often through multiple trials and frustrations, the limitations of many software packages that we used to trust unconditionally.