
Updated: April 30, 2020. Follow-up post (5/12/2020) here.
by Rachel Chung, Grant van Inwegen, Ezra Kohn, Jesse Simmons, and Jesse W. Torgerson
The Traveler’s Lab at Wesleyan University studies the movement of people and objects during the middle ages. Our focus on travel brings overlooked and unrecognized realities to standard historical narratives. In mid-March, as Wesleyan’s campus shut down in response to the COVID-19 pandemic, the Theophanes Project began applying our movement-focused approach to the present crisis. What follows are some results of our collaborative work. Data collection by Rachel Chung (’20), Ezra Kohn (’20), and Prof. Jesse Torgerson. Mapping by Grant van Inwegen (’20) and Jesse Simmons (’21) with assistance from Prof. Kim Diver.
New York City’s Battle with COVID-19 is not New York City’s Battle Alone
Click the image to enter our visualization of the regional context of the spread of COVID-19 around New York City. Following is an explanation and a brief guide.
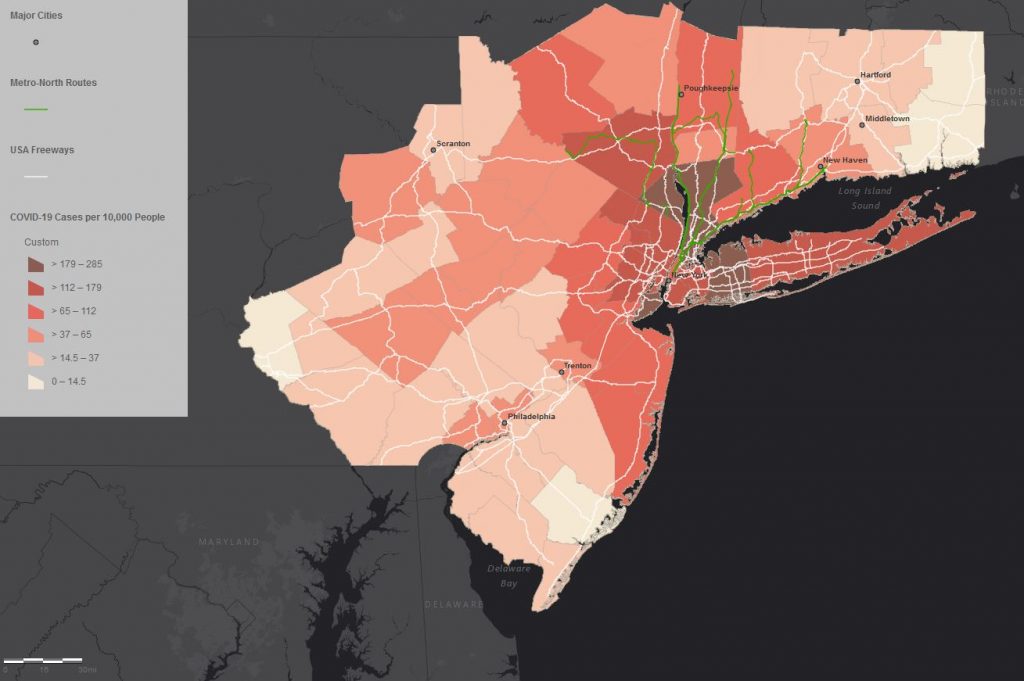
As early as March 22 New York City was declared an epicenter of the global COVID-19 pandemic. However, reporting has almost entirely covered New York City in isolation from its surrounding region, or at best in the context of New York state as a whole. All other “epicenters” of the pandemic (Hubei Province, Northern Italy, Central and Northern Spain) are studied and reported on as regions, not single cities.
The numbers of cases and fatalities from New York City alone give an inaccurate picture of the scope and nature of the region’s affliction. While New York City may be the center, it is the travel region immediately surrounding the city that provides the true context of how COVID-19 has spread and is spreading to, and from, the City. We created a regional context for NYC based on human movement rather than artificial political borders. Ignoring the borders of states entirely, we picked counties that were within an approximately 2-hour driving time from NYC, incorporating counties from not only New York, but New Jersey, Connecticut, and Pennsylvania (see our footnotes below for a full list of counties depicted).
The Traveler’s Lab COVID-19 map addresses how this pandemic has settled into the entire commuting region around New York City by providing three aspects either unavailable or unclear in visualizations such as the Johns Hopkins, UCONN, or NY Times maps:
(1) a time slider that re-presents the development of the crisis since March 1, 2020
(2) counties shaded by percentage of the population tested positive for COVID-19 rather than bubbles representing total case counts
(3) a demonstration of how this pandemic has actively spread along lines of travel rather than according to political boundaries
Traveler’s Lab research projects start with the premise that cities are never isolated, static collections of residents. Cities are centers of exchange and travel networks. Informed by geographic and historical methods, this approach provides a truer context for human interactions. Our geographic visualization of the spread of COVID-19 thus began with road and rail networks. Onto these we overlaid official county-by-county data on confirmed COVID-19 cases. Since our approach is also historical rather than journalistic our “time slider” map preserves data from the first reported case in New York City on March 1, 2020, up to the present (updated every three days).
Features of the Traveler’s Lab COVID-19 Map
Since our methodology is based on human travel rather than political regions, we depicted major freeways, highways, and commuter rail lines out of New York City rather than state borders. Ideally we would have shaded infection rates by municipality rather than county, but such specificity surpassed our data collection abilities. To avoid an overly-cluttered map we only identified a few cities for purposes of orientation. Please see our metadata here.
The dynamic features of the map permit historical and comparative study of the counties in this region. One of the notable conclusions of our comparison is that while the hospitals of New York City are certainly the most overwhelmed with the daily influx of a massive total number of newly infected patients, as of April 24th the counties of Rockland, Richmond, Westchester, and Nassau are in fact more deeply afflicted when considering infection rates relative to population. Similarly, Hudson (NJ), Passaic (NJ), Union (NJ), and Orange (NY) Counties are as deeply afflicted as the communities of Queens and Staten Island.
Users may pursue their own comparative questions about the day-by-day spread of the pandemic through the region by clicking “play” on the time slider (bottom right).

To toggle to a particular day, click pause and either click the forward or backwards buttons, or slide the cursor forward or backward as desired. To change how quickly each new day loads, click the “1x” speed toggle.
In addition to visualizing the spread of COVID-19 in the NYC region since March 1, users may also study the daily data for every county with infections present.

When a particular county is clicked for any particular day (as Nassau for April 24, above), users will see: (a) new cases reported in that county on that day; (b) total cases for that county since March 1; (c) number of residents with confirmed COVID-19 per 10,000 residents; (d) total fatalaties for that county since March 1; (e) the percentage of confirmed cases that have resulted in fatalities; (f) the county’s population as of 2019.
Addressing the Spread of COVID-19 by Facilitating a Collaborative Regional Approach
COVID-19 is spreading through our single population rather than through distinct states. Despite the best intentions of local representatives, governors, and media outlets, the extent to which the regions immediately surrounding New York City are all enveloped in a single crisis is not yet fully recognized. Governors Andrew Cuomo of New York, Ned Lamont of Connecticut, Phil Murphy of New Jersey, and Tom Wolfe of Pennsylvania have all made extensive efforts to sustain dialogue and work collaboratively. Even so, we believe it remains urgent to continue to develop and sustain unified policies and plans that are systematically enforced across the region.
We hope that our visualization can contribute to enhancing the focus of collaborative efforts by making the inter-connectedness of our localities evident, especially as we move into a period where regions begin considering how to “reopen.” By presenting historic data rather than only live data we also hope to provide our fellow residents the ability to maintain a historical perspective on how this situation has developed, and continues to develop. Finally, we hope the context of an accurate bigger picture might serve as evidence of the need for collaboration and mutual aid in other regions where the crisis is only beginning to unfold.
Footnotes: Sources and Notes
Since March 24th we have collaboratively collected our data of county-by-county confirmed COVID-19 cases on a daily basis from the official updates provided by the Departments of Health of New York, New Jersey, Connecticut, and Pennsylvania. We periodically check for errors by back-checking our data against the data published by the New York Times, and by the crowd-sourced reporting of 1Point3Acres. Our data on the population and size of each county was derived from the US Census data contained in the Esri feature layer “USA Counties.”
Notes on idiosyncrasies in the data.
From March 1-March 16 our map records the total number of cases in New York City, as reported by New York State, without making distinctions for the five counties (boroughs) within the City: Bronx, Kings (Brooklyn), New York (Manhattan), Queens, Richmond (Staten Island). For these dates, we noted all NYC fatalities and cases in New York County (Manhattan).
For March 17 to April 5 we used the data provided by New York City Health to distinguish the confirmed cases for each of the five New York City counties. This meant, however, that for this range of dates, we drew numbers for these five counties with a different time stamp than the published state data on the number of confirmed cases in NYC as a whole. We decided that the greater articulation achieved was more valuable than perfectly matching numbers.
From April 6 on, New York State began including distinct data for the five New York City counties (rather than grouping them all together as “New York City”), and we thus returned to using this state data for our tabulations rather than the New York City data.
For April 16 and April 17, New York State produced no fatality counts , except for a total number of fatalities from NYC for each of those days. In keeping with the practice noted above, we added these numbers to New York County (Manhattan). This results in wildly varying county-specific statistics for New York County from April 15 through April 18.
List of counties studied:
New York State: Bronx, Dutchess, Kings (Brooklyn), New York (Manhattan), Nassau, Orange, Putnam, Queens, Richmond (Staten Island), Rockland, Suffolk, Sullivan, Ulster, Westchester
New Jersey: All
Connecticut: All
Pennsylvania: Berks, Bucks, Carbon, Chester, Dauphin, Delaware, Lackawanna, Lancaster, Lebanon, Lehigh, Luzerne, Monroe, Montgomery, Northampton, Philadelphia, Pike, Schuylkill, Wayne